Debugging a MobileFirst Sliverlight and Windows 8.1 Universal Apps
Vinod Appajanna May 01, 2016
MobileFirst_Platform Windows_8 Silverlight Debugging


In this blog I will share a few ways of debugging or troubleshooting an MobileFirst Windows Silverlight and Windows 8.1 Universal apps (Desktops, tables and phones). I will be debugging JavaScript code, managed code (C#), native code (C/C++) and combination of these.
Basically we will cover
- Console log outputs
- Break point support
- remote debugging using remote debuggers like VORLON or WINRE.
You can see the below screen shots and videos for the flow and debugging techniques used. Along with the videos there are samples attached for you to try.
Debugging a Silverlight App
The High level flow shows the launching of the app from Visual Studio on to device or emulator and logs output to the Visual studio console and vorlon console and also the markup exchange between Vorlon and the device. Here the debugging involves the html, JavaScript and C# (managed code).
High level flow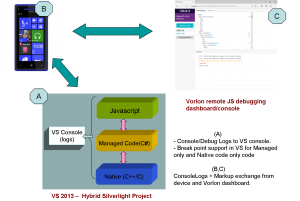 |
Visual Studio flow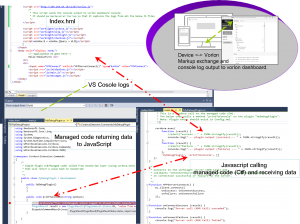 |
Debugging a Windows Phone 8.1 App
In here the debugging with Vorlon is not included since its already covered as part Siliverlight App debugging and here I have tried covering the debugging of the native (C/C++) code for universal apps.
High level flow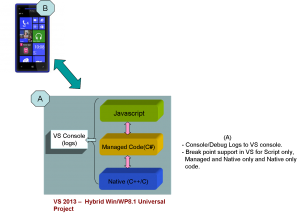 |
Visual Studio flow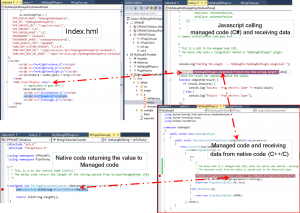 |
You read more at the articles below.
(1) Six ways to debug a hybrid Worklight application
(2) Windows Phone 8 IE10 Javascript debugging
Inclusive terminology note: The Mobile First Platform team is making changes to support the IBM® initiative to replace racially biased and other discriminatory language in our code and content with more inclusive language. While IBM values the use of inclusive language, terms that are outside of IBM's direct influence are sometimes required for the sake of maintaining user understanding. As other industry leaders join IBM in embracing the use of inclusive language, IBM will continue to update the documentation to reflect those changes.