Building custom charts using IBM Cloud Mobile Analytics service and IBM Mobile Foundation Service.
Parvathy Unnikrishnan May 02, 2018
MobileFirst_Foundation Mobile_Foundation_Service IBM_Cloud Bluemix Analytics


Overview
IBM Mobile Foundation Service can be configured to connect to IBM® Mobile Analytics service for IBM Cloud to pump the analytics events and logs. Currently the Mobile Analytics service doesn’t support out-of-the-box Mobile Foundation Service specific features like custom charts and adapter analytics. However, there is an approach where you can exploit the ‘Db2 Warehouse export’ option of the Mobile Analytics service and achieve the building and viewing of Custom charts or analytics for Mobile Foundation Adapters.
This blog details this approach of building custom charts using Mobile Analytics service and Mobile Foundation leveraging the Db2 Warehouse on cloud service capabilities for charting. You can use the Mobile Foundation server installed on your on-premises environment or quickly configure a Foundation server on IBM Cloud using the IBM Mobile Foundation service. We will use the Mobile Foundation service on IBM Cloud in this blog.
Prerequisite:
Log in to IBM Cloud and create a Mobile Foundation service.
Create BMS Analytics service in IBM Cloud and configure Mobile Foundation service instance with it.
Exporting analytics data from Mobile Analytics service to ‘Db2 Warehouse on Cloud’ service.
- Launch Console from Mobile foundation service and open Analytics service console from there.
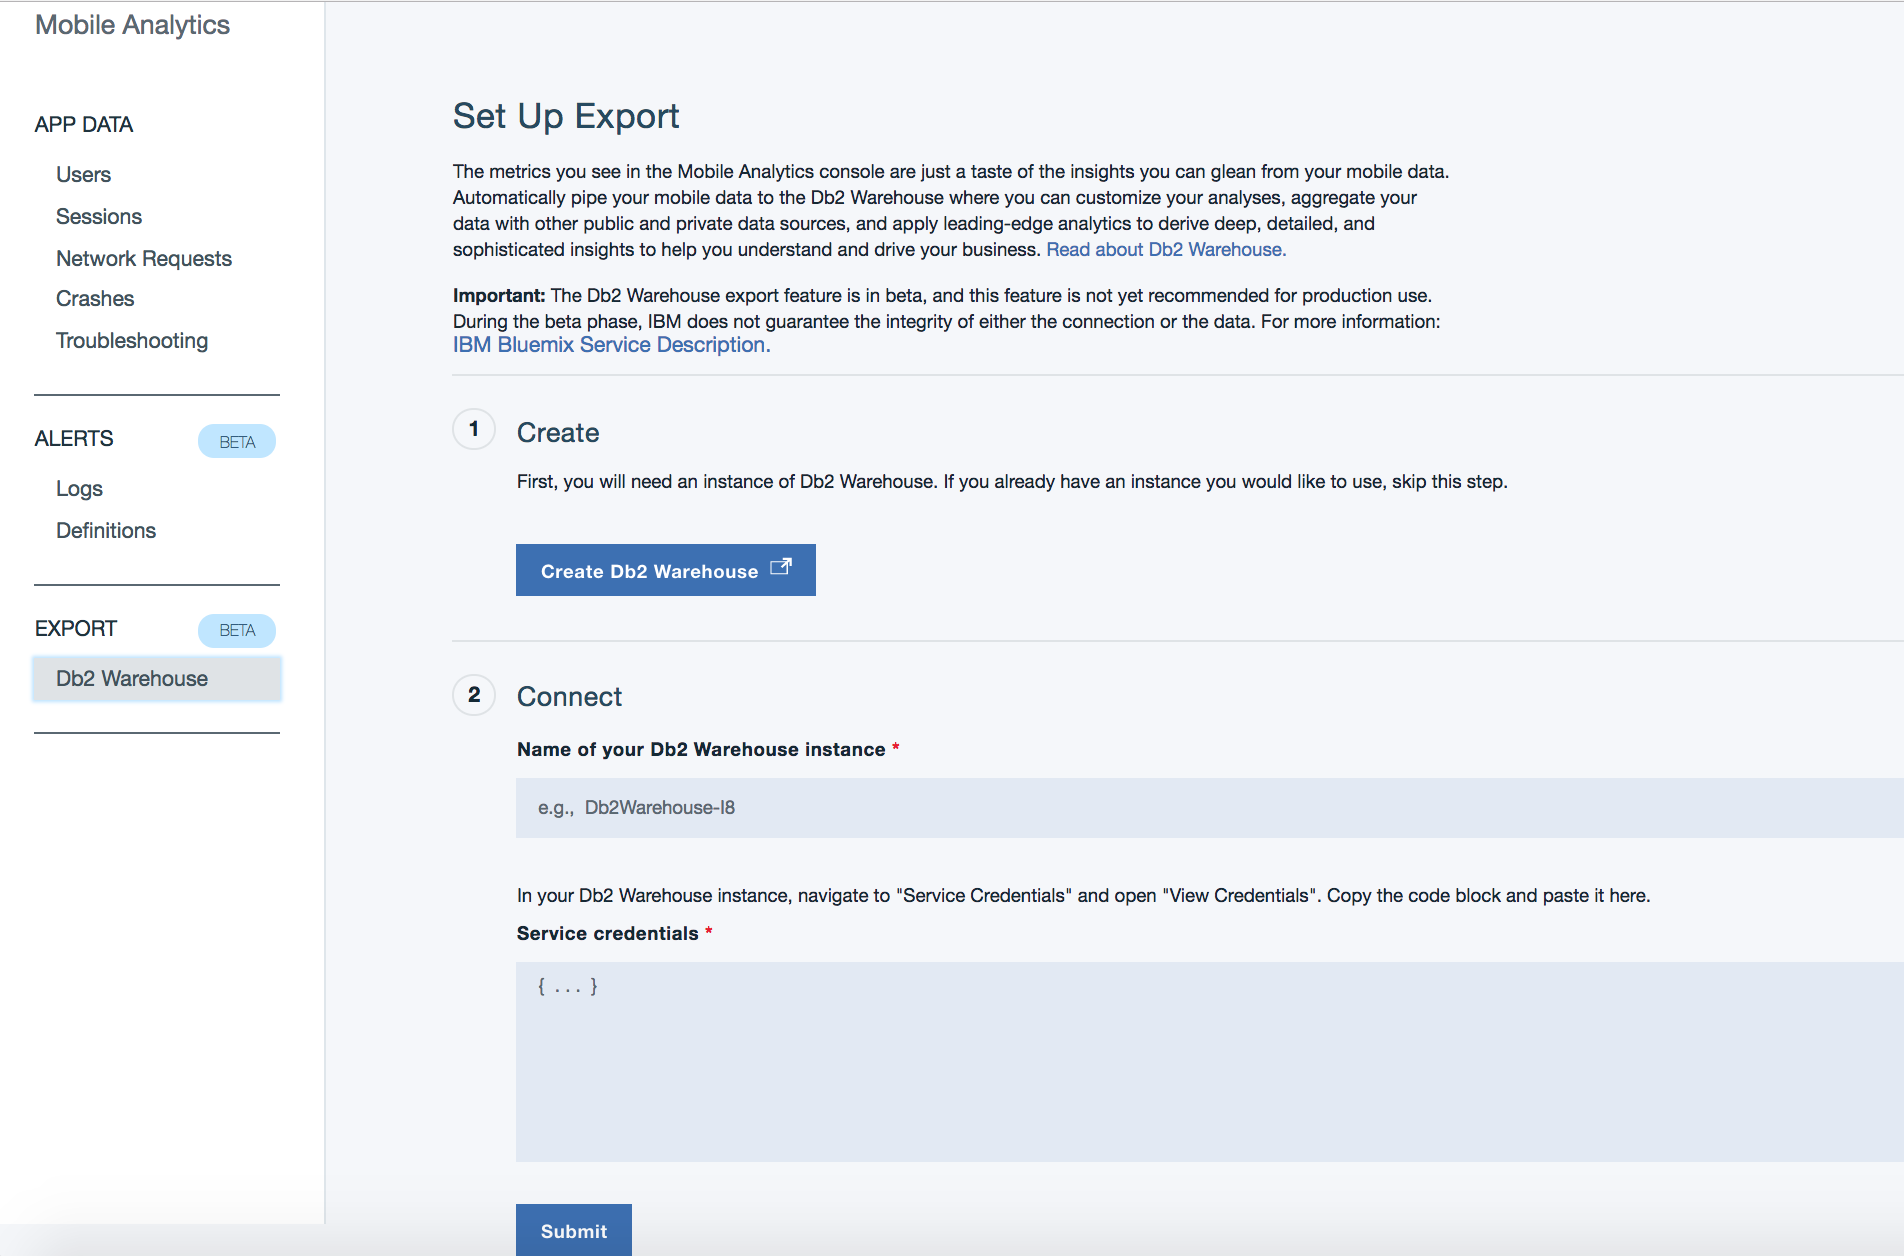
- On the left side click on Db2 Warehouse under Export.
- This enables the analytics data export to Db2 Warehouse.
-
Follow the steps as listed there and click on Create Db2 Warehouse. This takes you to the Bluemix Db2 Warehouse service creation page; choose the IBM Db2 Warehouse on Cloud Entry plan and create the instance.
-
Add some custom events in a mobile app using the Mobile Foundation SDK. A sample code snippet for the same from android is given below.
- Go to Service Credentials tab and click on New credential. Click on Add to create a new credential for Db2 Warehouse.
- Under Actions, click on View credentials and copy the credential details to clipboard (use the copy to clipboard button on the right.)
- Go back to Mobile Analytics console, select Db2 Warehouse under Export and go to the second step in “Set Up Export” page. Here paste the Db2 Warehouse credentials that you had copied earlier into the clipboard and click on Submit.
-
On submission, the view displays the export enabled page which details the DB schema and tables that would be created in Db2 Warehouse.
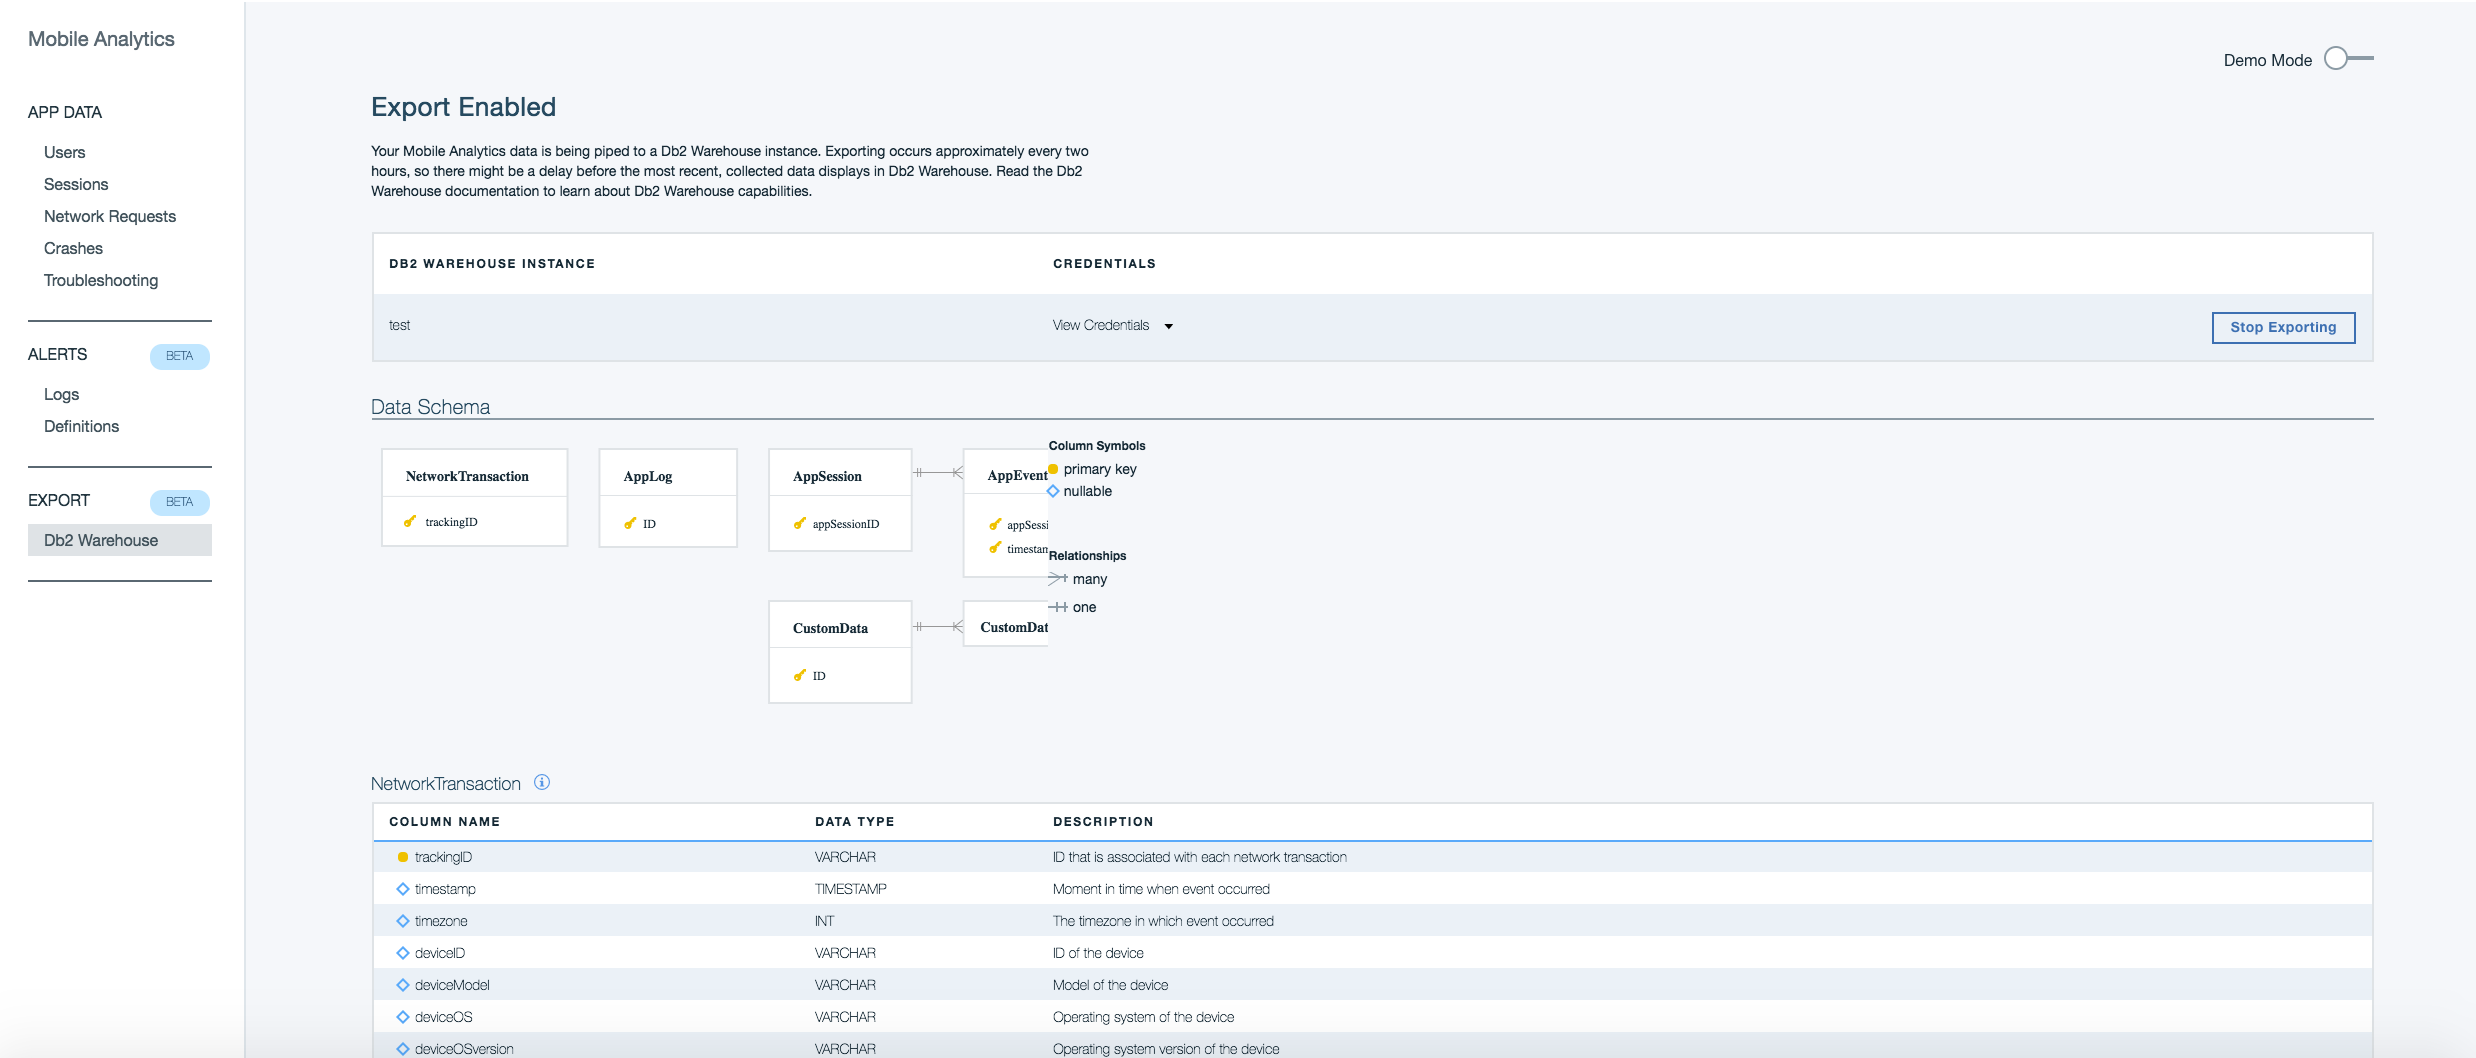
-
Add some custom events in a mobile app using the Mobile Foundation SDK. A sample code snippet for the same from android is given below.
public void onButtonEventAClick(View view) { JSONObject json = new JSONObject(); try { json.put("EventTrigger”, “A”); } catch (JSONException e) { e.printStackTrace(); } WLAnalytics.log("CustomEvent", json); } - Register the app to connect to the Mobile foundation service and trigger the custom events from mobile application. Check the analytics screens in the Mobile Analytics console. See the custom data sent under Troubleshooting > App Log Search.
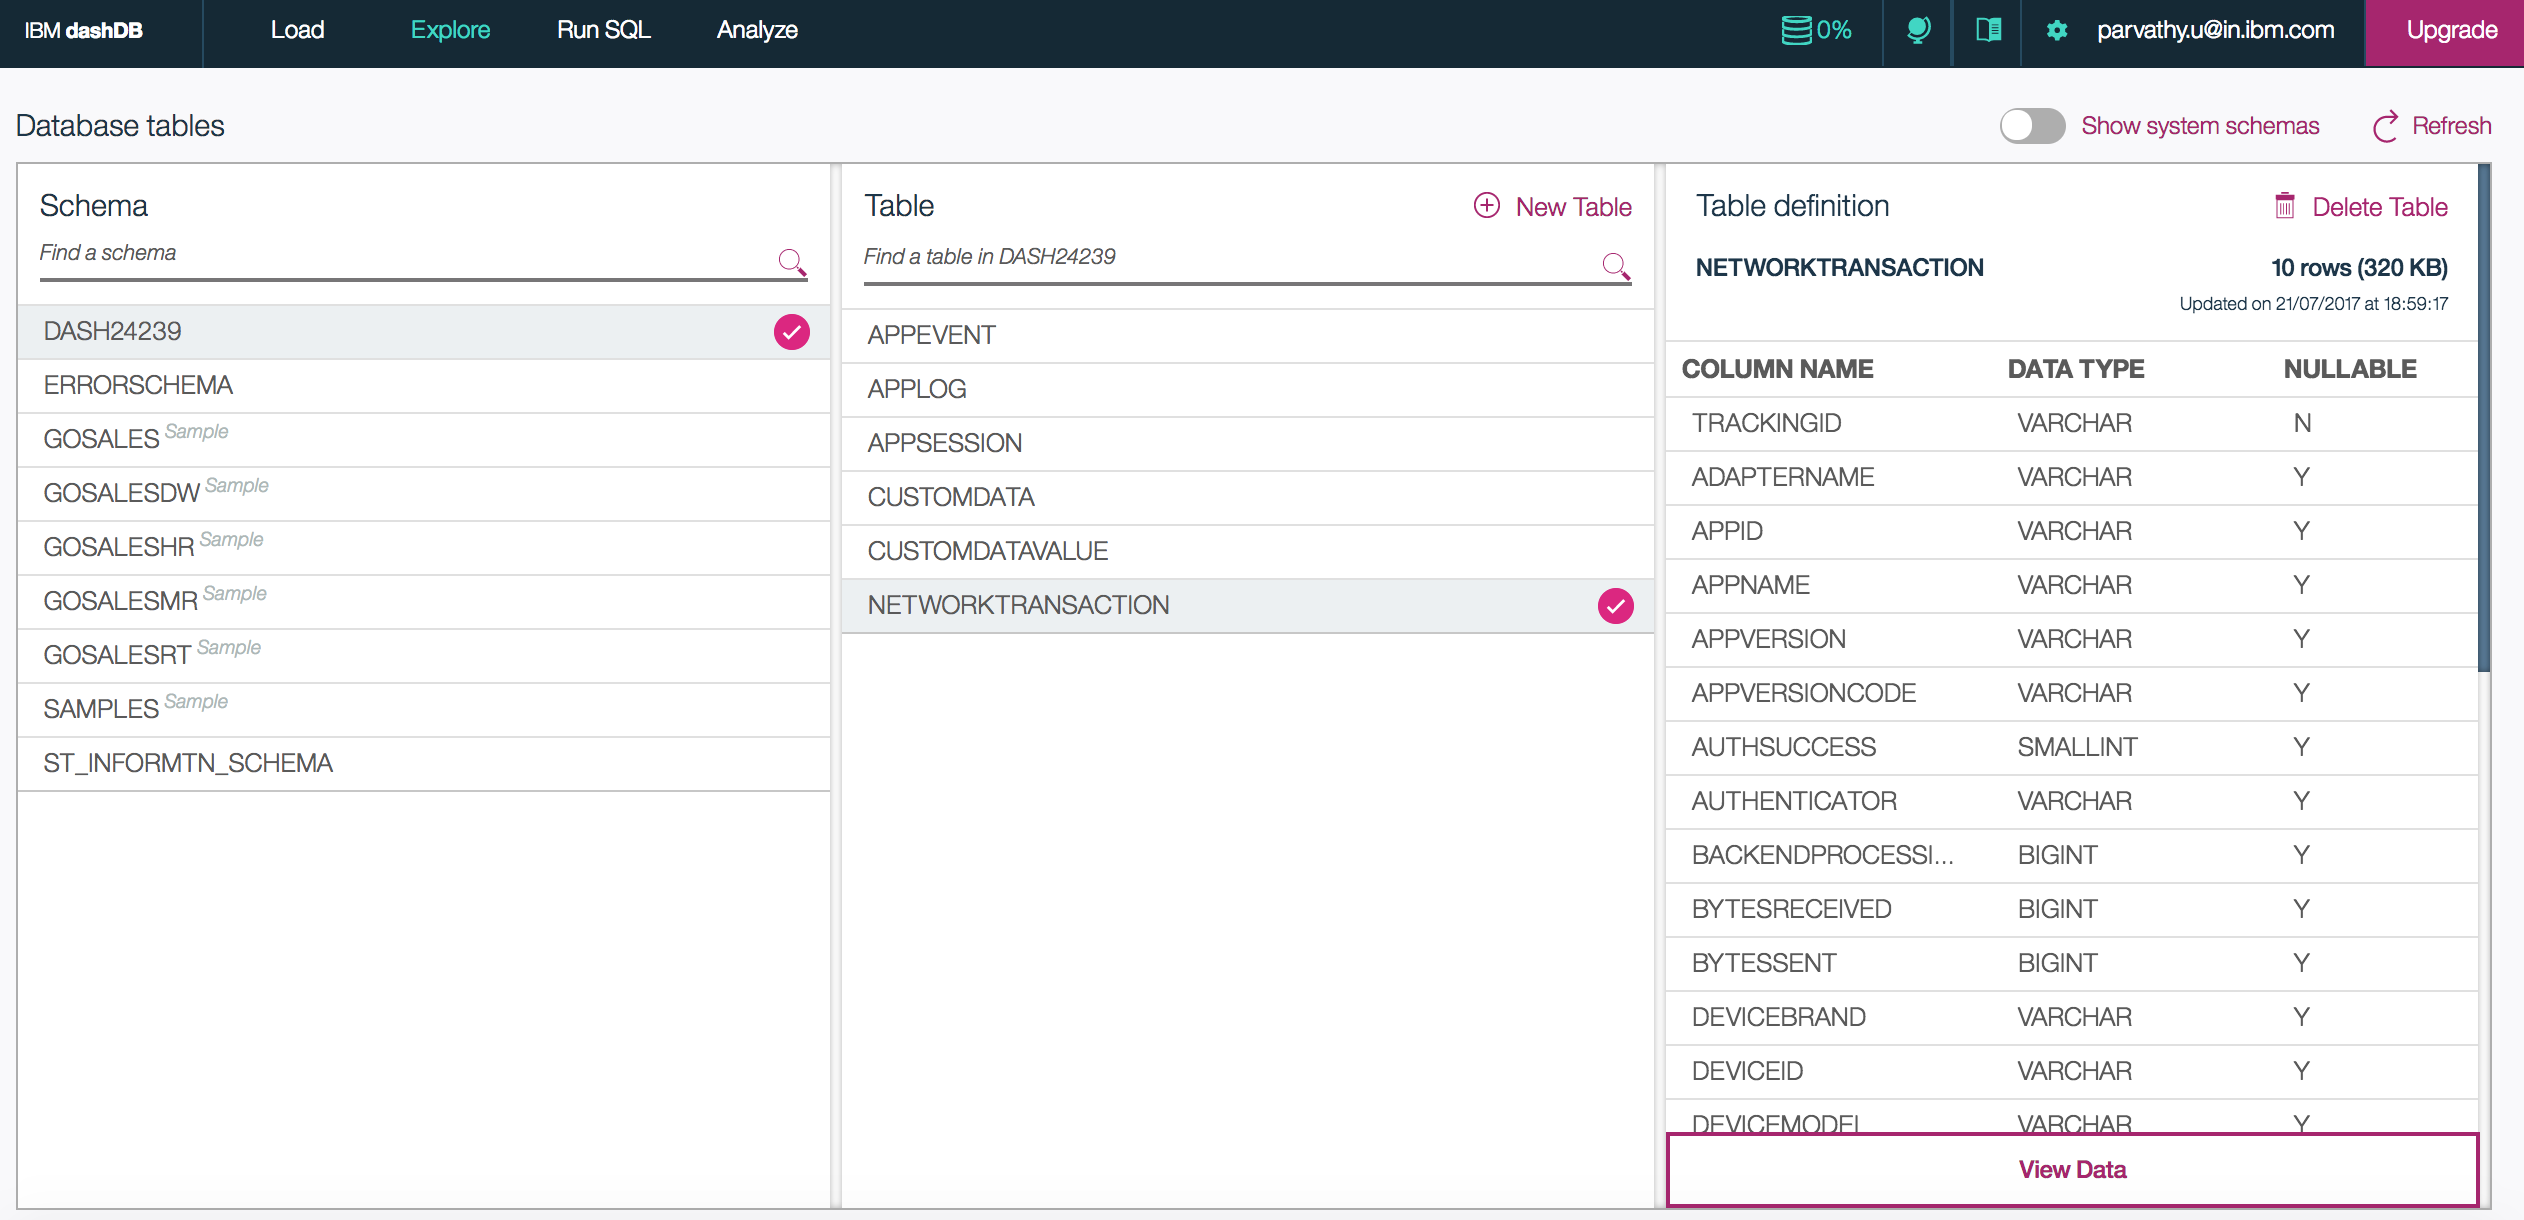
- Now from Bluemix Dashboard, select the Db2 Warehouse on Cloud service which will open its service console. On the console, click on Open. This opens the Db2 Warehouse with the DB schema that has been created for Mobile Analytics.
-
Click on Explore on the top of the page. The DB schema name can be found from the Db2 Warehouse credentials which is used for Mobile Analytics. Click on the DB schema name. Here all tables should get listed as shown below. Click on a table to see the table description.
-
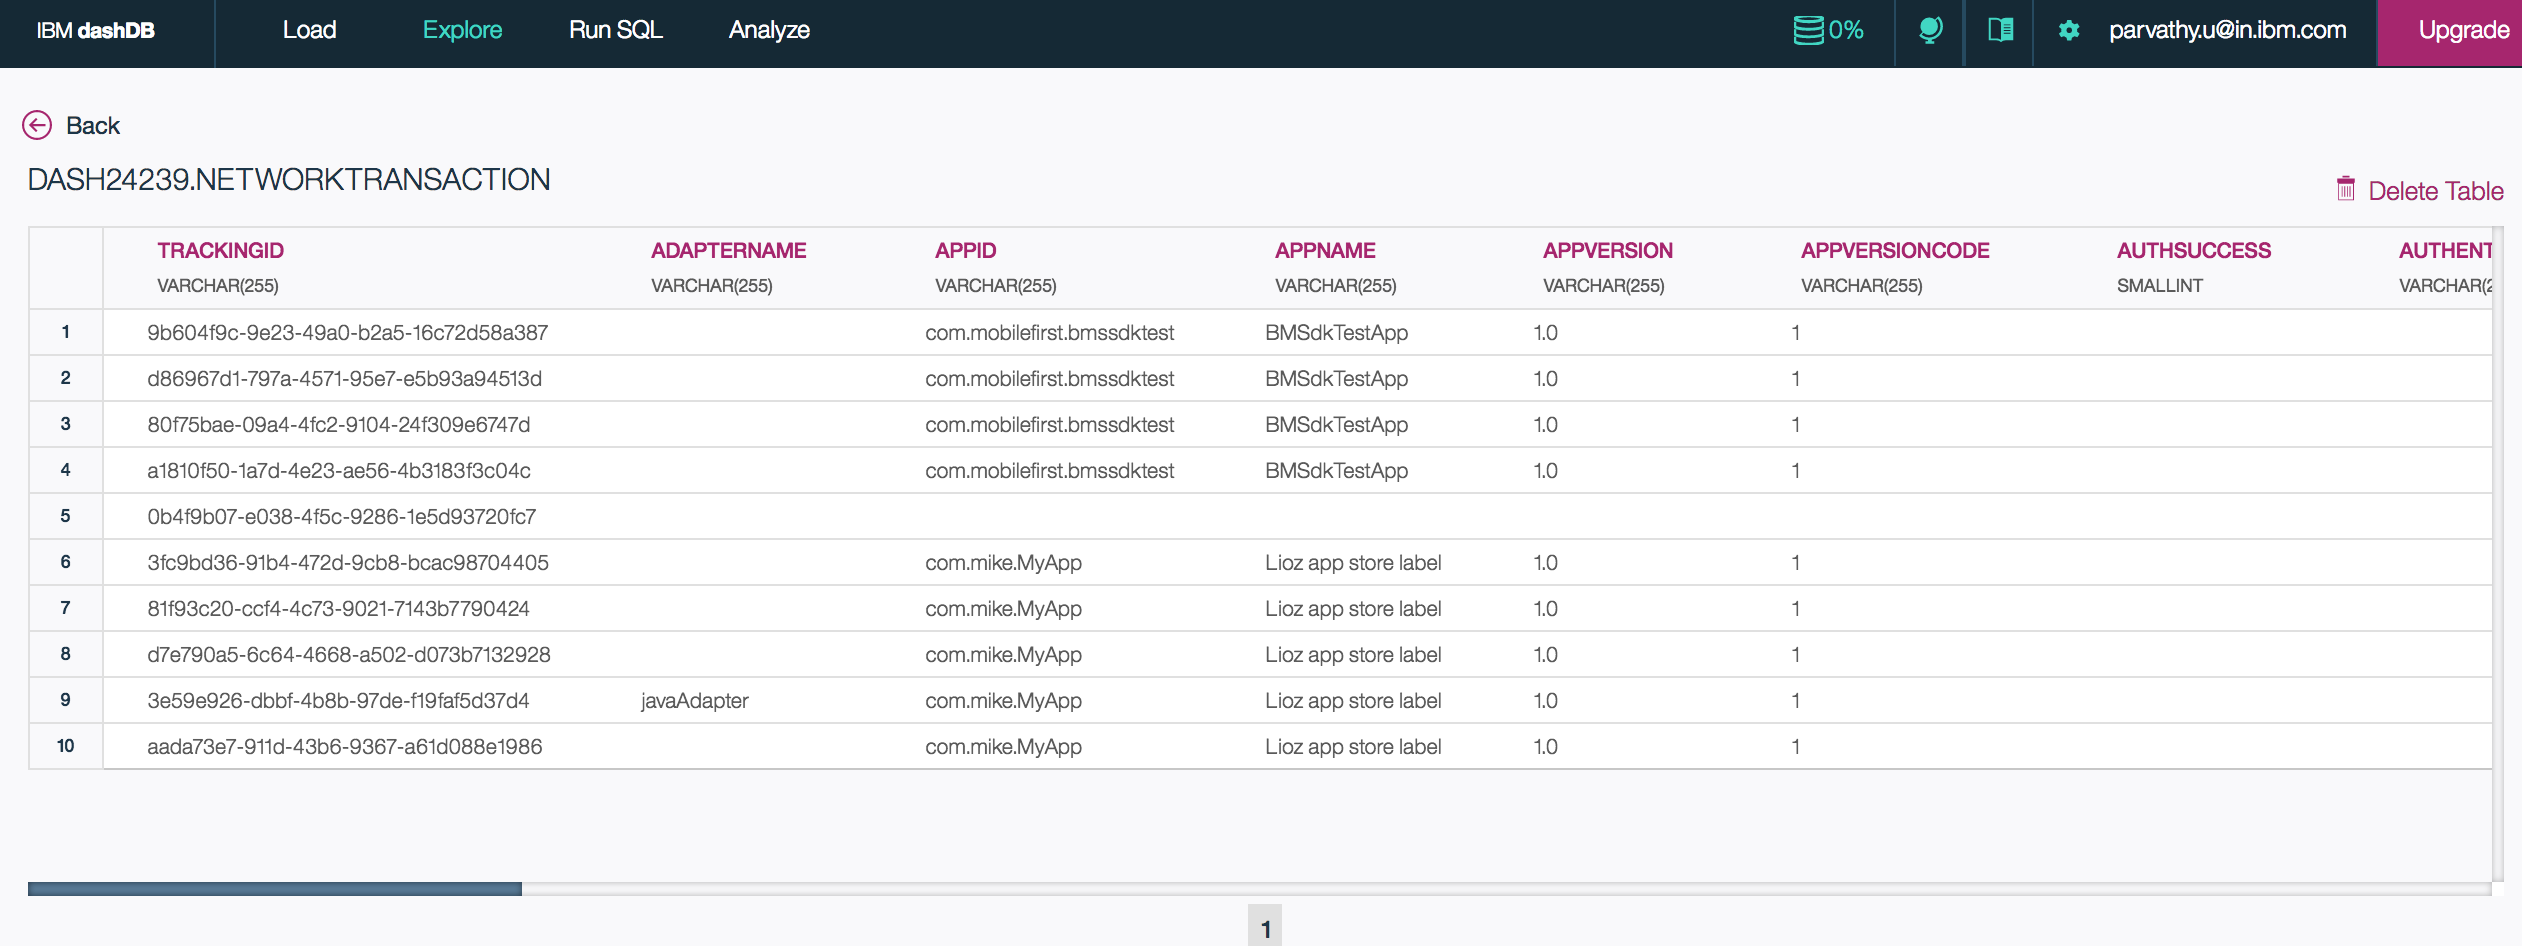
Click of View Data below the table description to see the table contents.
Creating and running R script to plot custom data analytics charts in Db2 Warehouse
- Choose CUSTOMDATAVALUE table and click on View Data to see that all the custom events sent from Mobile Analytics is available here.
- Db2 Warehouse on cloud comes with R studio where the R scripts can be run to create charts.
- Click on Analyze > Launch R studio. The login credentials for R studio is the _
_ and _ _ in the service credentials of Db2 Warehouse which was created above. - R studio has a mainly four windows. Click on + on the top left and choose R script.
-
Under the Script area add your R script and Save the same as below.
-
A Sample R-script is posted below
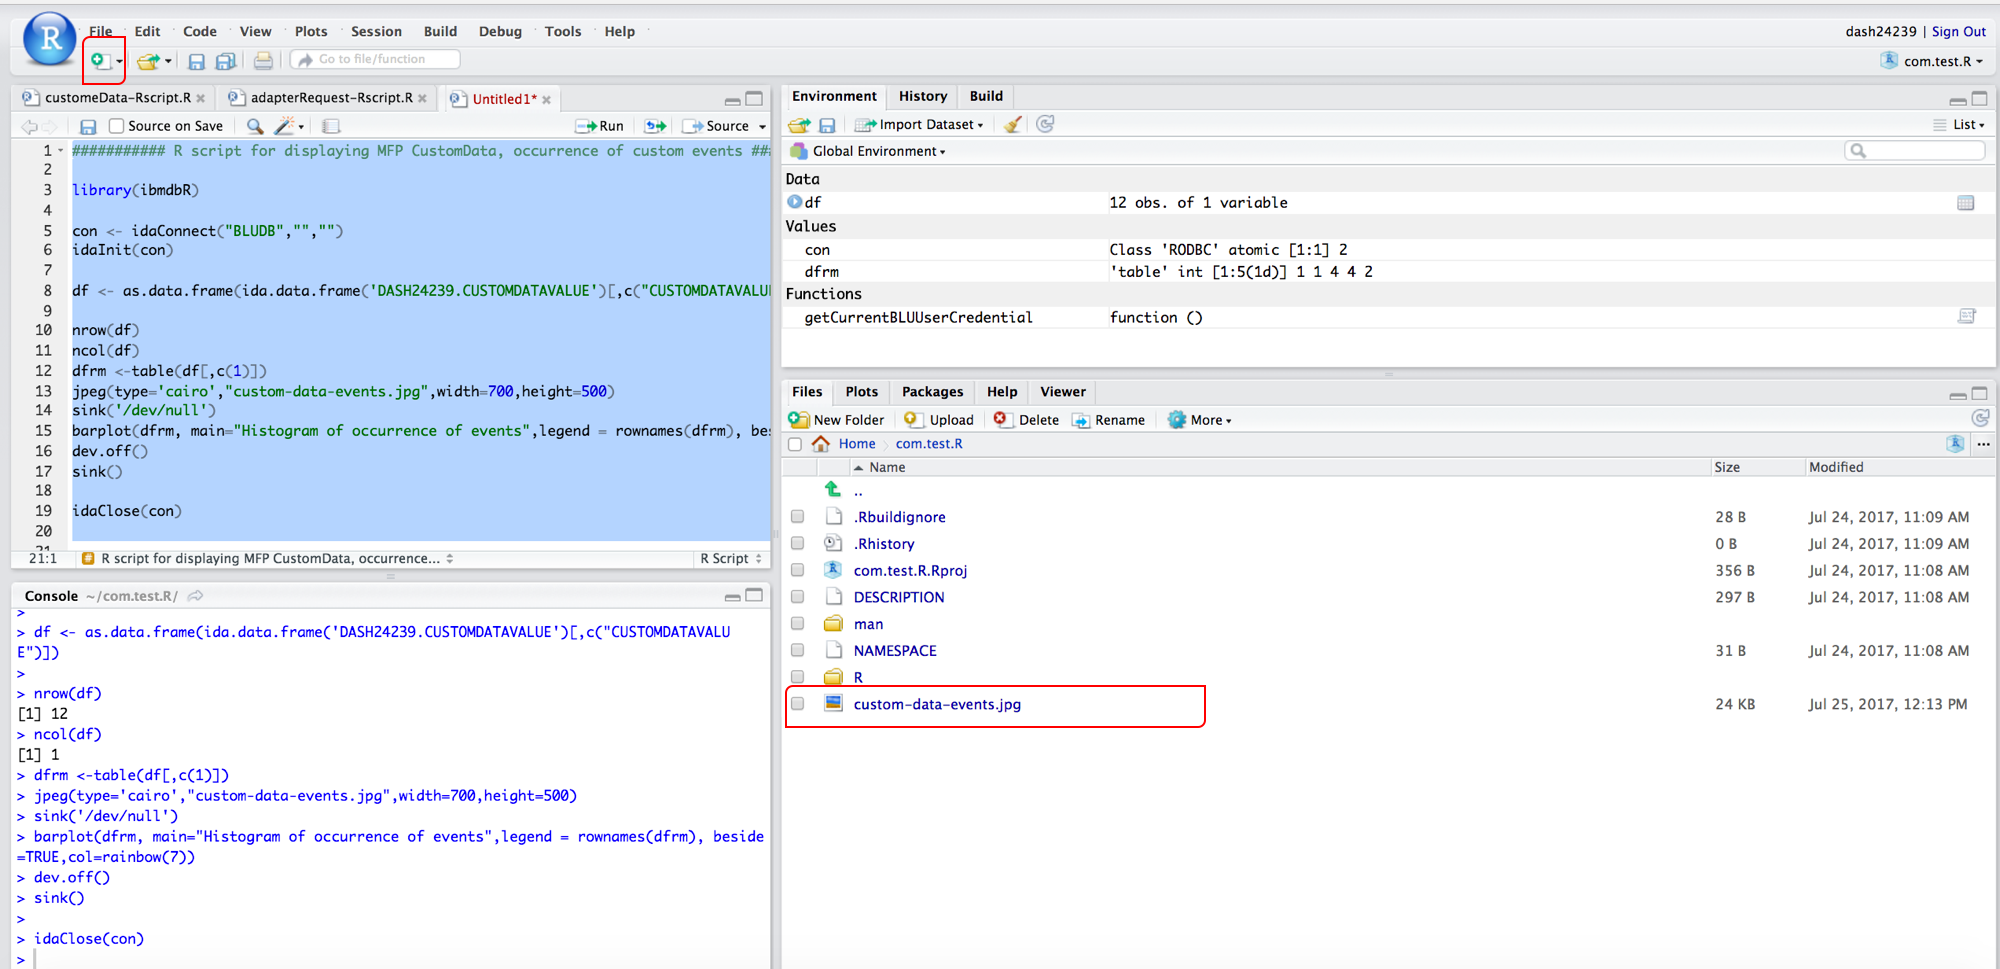
########### R script for displaying MFP CustomData, occurrence of custom events ############### library(ibmdbR) con <- idaConnect("BLUDB","","") idaInit(con) df <- as.data.frame(ida.data.frame('DASH7558.CUSTOMDATAVALUE')[,c("CUSTOMDATAVALUE")]) nrow(df) ncol(df) dfrm <-table(df[,c(1)]) jpeg(type='cairo',"custom-data-events.jpg",width=700,height=500) sink('/dev/null') barplot(dfrm, main="Histogram of occurrence of events",legend = rownames(dfrm), beside=TRUE,col=rainbow(7)) dev.off() sink() idaClose(con) - Replace the database schema name with yours.
- To run the complete script, in the scripting window select all the content and click Run.
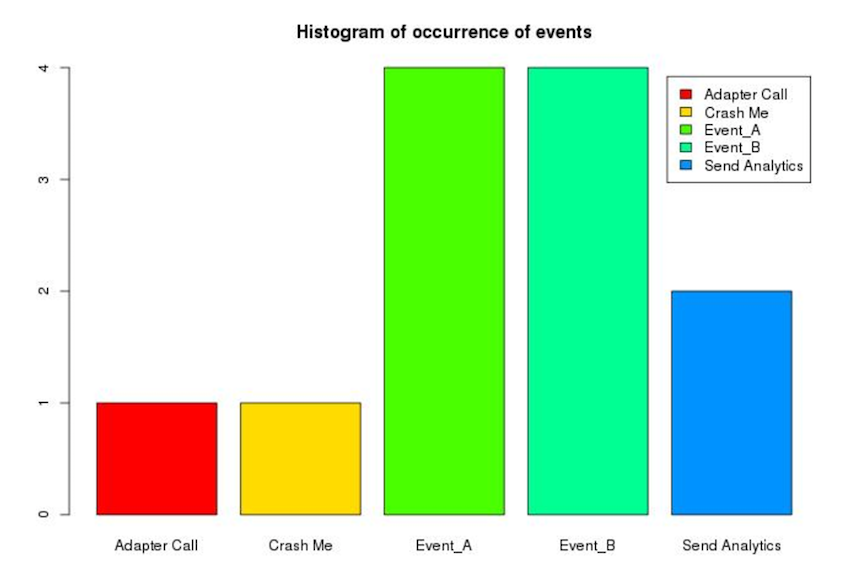
- Once run successfully, it creates the chart image as ‘custom-data-events.jpg’ under Files tab in the bottom right window as shown in the above screenshot.
- Click on the picture to see the chart.
- See the Console window for any errors.
-
Further details of R studio usage can be found in R studio Help.
Inclusive terminology note: The Mobile First Platform team is making changes to support the IBM® initiative to replace racially biased and other discriminatory language in our code and content with more inclusive language. While IBM values the use of inclusive language, terms that are outside of IBM's direct influence are sometimes required for the sake of maintaining user understanding. As other industry leaders join IBM in embracing the use of inclusive language, IBM will continue to update the documentation to reflect those changes.