Best Practices for setting up MobileFirst Analytics production Cluster
improve this page | report issueOverview
This topic describes the list of best practices that include the DOs and the DON’Ts to be followed while setting up an Analytics Server in production.
MobileFirst Analytics Server - Configuration settings
Data purging has to be applied to the production environment, mandatorily, in order to not persist the entire document set from the beginning. By setting the appropriate TTL values for various event documents, the search scope for Elasticsearch queries can be reduced considerably. Following are the TTL values that are to be set for the MobileFirst Analytics v8.0 Server:
TTL properties for Analytics Event/Documents
- TTL_PushNotification
- TTL_PushSubscriptionSummarizedHourly
- TTL_ServerLog
- TTL_AppLog
- TTL_NetworkTransaction
- TTL_AppSession
- TTL_AppSessionSummarizedHourly
- TTL_NetworkTransactionSummarizedHourly
- TTL_CustomData
- TTL_AppPushAction
- TTL_AppPushActionSummarizedHourly
- TTL_PushSubscription
Example usage:
<jndiEntry jndiName="analytics/TTL_AppLog" value= '"20d"' />
TTL value are expected to be String literals and should be passed within single quotes.
MobileFirst Analytics Server - Topology
Multi-Node Analytics Cluster
- It is important to have a load balancer in front of the nodes to ensure that the analytics layer is offered an even load across the nodes.
- In a two-node analytics cluster when a load balancer is not used, it is good to configure or use the Analytics console of the node that is not used for accepting the data from the MobileFirst Server.
For example:
Consider that there are two nodes for the analytics server. In such a case, the recommendation for MobileFirst server configuration for analytics is as below:
Recommended:
mfp.analytics.url -> http://node1:9080/analytics-service/rest
mfp.analytics.console.url -> http://node2:9080/analytic/console
NOT recommended:
mfp.analytics.url -> http://node1:9080/analytics-service/rest
mfp.analytics.console.url -> http://node1:9080/analytic/console
This allows the user to reduce the load on the nodes when the user views the analytics console.
MobileFirst Analytics Server - Performance Tuning
Operating System Tuning
- Increase the allowed number of open file descriptors to 32k or 64k.
- Increase the virtual memory map counts.
Note: Check the corresponding documentation for the Operating System .
Application Server Tuning
If you are on WebSphere Application Server v8.5.5.6 Liberty Profile or earlier versions, ensure that you tune the JVM Thread Pool size settings explicitly.
This behaviour resulted in many users setting the coreThreads value of the executor to a high number to ensure that the executor never landed in a deadlock. However, in v8.5.5.6 the auto-tuning algorithm is modified to aggressively fight deadlocks. Now it is nearly impossible for the executor to deadlock. So if you have manually set coreThreads in the past to avoid executor deadlocks, you might want to consider reverting to the default value once you move to v8.5.5.6.
Example:
<executor name="LargeThreadPool" id="default" coreThreads="200" maxThreads="400" keepAlive="60s" stealPolicy="STRICT" rejectedWorkPolicy="CALLER_RUNS"/>
Analytics Tuning
- Both Java Xms and Xmx has to be set (Min and Max) as same.
- Maximum allowed Heapsize Per JVM <= RAM Size/2.
- Number of Primary Shards = Number of Nodes of the Analytics Cluster.
- Number of Replica per shard >= 2.
Note: If there is only one node then there is no need of a replica.
Elasticsearch Tuning
Elasticsearch tuning can be performed in a separate YAML file (for example, it can named as elasticsearchconfig.yml), the path to this file can be configured in the analytics server configuration (using the JNDI properties).
Property Name: analytics/settingspath
Value: <path_to_the_ES_config_yml>
Apply the Elasticsearch tuning parameters by adding the values to a .yml file and accessing it using the JNDI entry.
Elasticsearch tuning parameters are to be considered for a basic tuning of the environment and can be tuned further based on the infrastructure resources:
-
Set a value for indices.fielddata.cache.size
For example:
indices.fielddata.cache.size: 35%Note: Use analytics/indices.fielddata.cache.size with caution. Do not increase it to a high value, as increasing this value can cause OutofMemory. The underlying technology used by the analytics platform loads several field values into memory to provide faster access to those documents. This is known as the field cache. By default, the amount of data loaded into memory by the field cache is unbounded. If the field cache becomes too large, it can cause an out of memory exception and crash the analytics platform.
-
Set a value for indices.fielddata.breaker.limit.
Set indices.fielddata.breaker.limit to a value greater than indices.fielddata.cache.size.
So, if the cache size is 35%, set breaker limit to a value greater than the cache size.
-
Set a value for indices.fielddata.cache.expire.
This value sets the expiry time of the Elasticsearch cache and prevents the cache from growing unbound and filling up the heap.
indices.fielddata.cache.expire
A time-based setting that expires field data after a certain time of inactivity. Defaults to -1. For example, can be set to 5 m for a 5 minute expiry.
-
The default setting for Analytics is to NOT purge any data.
Configure the TTL appropriately to ensure that data is purged. Otherwise, the data store can grow in an unlimited manner.
MobileFirst Analytics Server - DOs and DON’Ts
- Avoid clearing the analyticsData directory when the analytics nodes are running.
- In a multi node cluster, avoid using the same node for pushing the events into analytics cluster and access the console. Best practice would be to use a Load balancer in front of the analytics cluster.
- Avoid using any other Application Server clustering methodologies for Analytics Cluster. The underlying Elasticsearch creates cluster on its own using its node discovery mechanisms.
- Avoid using Open JDK (or Sun Java) for Analytics on IBM WebSphere Application Server Full Profile (or) IBM WebSphere Application Server Network Deployment.
- Never increase the Analytics min/max heap size to value greater than half of the RAM Size on the node. For instance, if you have a node with RAM size of 16 GB then the max allowed heap size is 8 GB for analytics.
- For analytics cluster name (analytics/clustername JNDI property), use a unique cluster name. Avoid using the default name worklight.
MobileFirst Analytics Server - SDK issues
1. Cordova Applications must initialize at native platform for Lifecycle events to enable AppSession capture
In MobileFirst Platform Foundation v8.0, the app sessions are incremented/recorded when the app goes from background to foreground.
Capturing AppSessions is enabled by adding listeners for lifecycle events. The native SDKs provide appropriate APIs for adding these listeners. However, in the case of Cordova there is no JavaScript API for adding these lifecycle event listeners. Instead, the listeners have to be added using native platform APIs even for Cordova applications.
Excerpt from the documentation:
After the Analytics SDK is configured, app sessions start to be recorded on the users device. A session in MobileFirst Analytics is recorded when the app is moved from the foreground to the background, which creates a session on the Analytics Console. As soon as the device is set up to record sessions and you send your data, you can see the Analytics Console populated with data, as shown below.
For example, for a Cordova app on iOS Platform (iOS) it is mandatory to add the following under AppDelegate.m:
[[WLAnalytics sharedInstance] addDeviceEventListener:LIFECYCLE];
[[WLAnalytics sharedInstance] send];
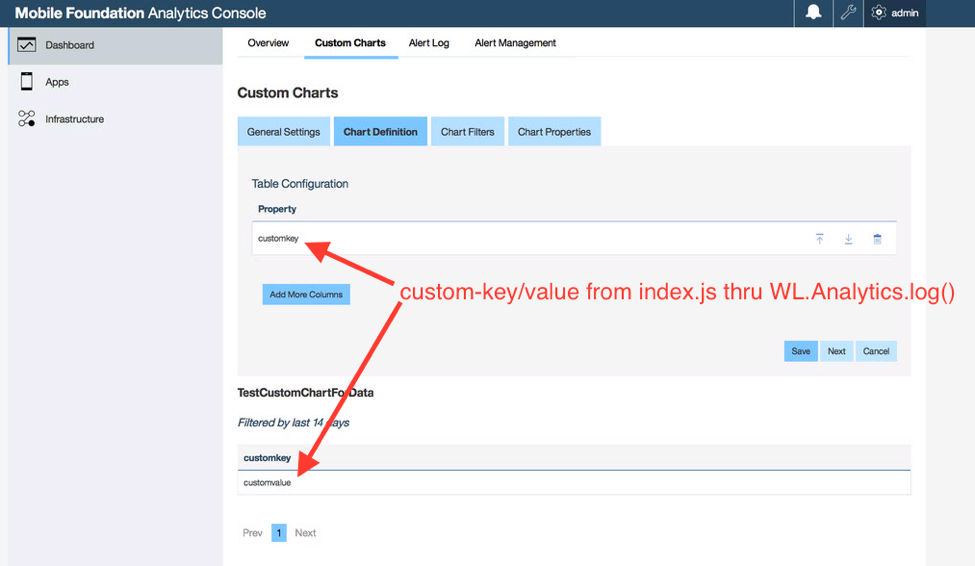
2. View the custom Data on Analytics console
To quickly locate the custom data sent to Analytics server using the Analytics Client SDK APIs, following step can be performed.
Go to Analytics Console > Dashboard > Custom Charts > Create a Custom Chart
For more information refer to the documentation here.
MobileFirst Analytics Server - Troubleshooting steps
- Customer Environment Version:
Gather the details of the complete software stack, including OS, JDK/JRE, AppServer, MobileFirst Platform Foundation version, and MobileFirst Platform Foundation build version. - Compare the environment details with IBM MobileFirst Analytics Software Compatibility Matrix/requirements.
- Gather the Analytics Topology & Hardware specifications used.
- Check if there was any performance tuning performed (in case of performance issues).
- Gather the MobileFirst Platform Foundation Server’s
server.xml(Liberty) and JNDI Environment entries/properties (WAS Full Profile/ND) to verify the Analytics integration configuration. - Gather the screen shot of the Analytics administration console.
- Gather the Analytics
server.xml(Liberty) and JNDI Environment entries/properties (WAS Full Profile/ND) to verify the Analytics integration configuration. - Collect the output of the following REST APIs (listed under the section – Important Commands & APIs for troubleshooting analytics issues).
Utilities for troubleshooting
Following are the open source tools which can be effectively used to visualize and administer the elasticsearch indices, data/shard allocation etc.
Important Commands & APIs For Troubleshooting Analytics Issues
Use cURL to run the following REST APIs to capture the response for identifying various information about the cluster/shard/indices:
http://<es_node>:9500/_cluster/health
http://<es_node>:9500/_cluster/stats
http://<es_node>:9500/_cat/shards
http://<es_node>:9500/_node/status
http://<es_node>:9500/_cat/indices
References
- MobileFirst Analytics - Quick & Dirty clusters
- MobileFirst Analytics - Planning for Production
- MobileFirst Analytics – Installation Guide
- Setting JNDI property for Mobile Analytics Time To Live(TTL) value as days in Liberty Profile
Inclusive terminology note: The Mobile First Platform team is making changes to support the IBM® initiative to replace racially biased and other discriminatory language in our code and content with more inclusive language. While IBM values the use of inclusive language, terms that are outside of IBM's direct influence are sometimes required for the sake of maintaining user understanding. As other industry leaders join IBM in embracing the use of inclusive language, IBM will continue to update the documentation to reflect those changes.