Monitoring Mobile Foundation in IBM Cloud Private (ICP)
improve this page | report issueOverview
This tutorial outlines how to integrate Prometheus to monitor Mobile Foundation running on IBM Cloud Private.
IBM Mobile Foundation provides monitoring capability by enabling mpMetrics-1.0 feature to monitor Mobile Foundation Server, Analytics and Application Center that are instrumented with the MicroProfile metrics API. This helps to monitor the JVM and system level metrics of your Mobile Foundation containers deployed on ICP.
The default response formats to /metrics API request is a text format, which is compatible with Prometheus.
Procedure
Complete the steps below to set up the monitoring of Mobile Foundation on IBM Cloud Private.
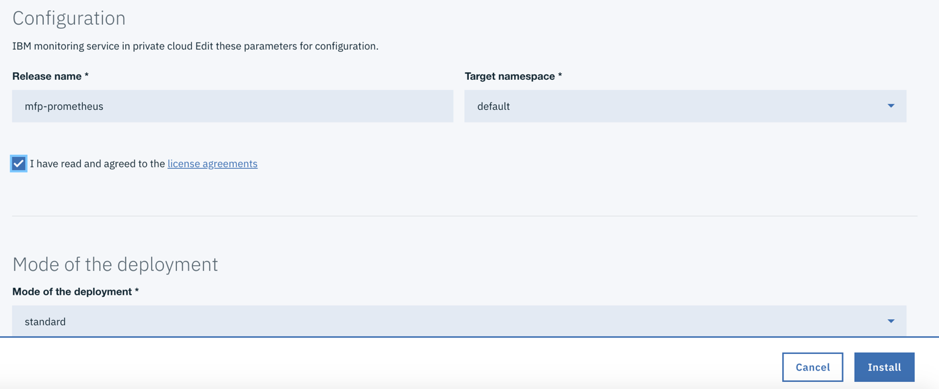
Step 1: Deploy the IBM Monitoring service
a. Deploy the Monitoring service from IBM Cloud Private catalog.
b. Go to Catalog , select ibm-icpmonitoring helm chart and install. The helm chart will get installed in your IBM Cloud Private.
Step 2: Update Prometheus configmap configuration
Run the following command, from a properly sourced terminal, which is a CLI instance having the contextual configuration information of the ICP cluster:
kubectl get svc | grep prometheus
You will see a number of services getting deployed by the ibm-icpmonitoring chart. In this tutorial, we will focus on and use the service named <name used for the helm release>-promethues (mfp-prometheus-prometheus), as shown in the screenshot below:

Each of these services has an associated configmap object. To get the metrics data of the Mobile Foundation pods, you need to modify the configmap associated with the mfp-prometheus-prometheus service by adding the mfpfserver annotation for Mobile Foundation server, mfpfanalytics annotation for Analytics and mfpfappcenter annotation for Application Center to the service deployment, along with a few other attributes.
The simplest way to achieve this is to edit the intended configmap object from a sourced terminal using the command below:
kubectl edit configmap mfp-prometheus-prometheus
This command will bring up the requested YAML file in the vi editor. Scroll down to the end of the file and insert the text below, just before the line kind: ConfigMap.
Mobile Foundation server Metrics configuration, YAML snippet below:
# Configuration for MFP Server Monitoring
- job_name: 'mfpf-server'
scheme: 'https'
basic_auth:
  username: 'mfpRESTUser'
  password: 'mfpadmin'
tls_config:
  insecure_skip_verify: true
kubernetes_sd_configs:
  - role: endpoints
relabel_configs:
  - source_labels: [__meta_kubernetes_service_annotation_mfpfserver]
    action: keep
    regex: true
  - source_labels: [__address__, __meta_kubernetes_service_annotation_prometheus_io_port]
    action: replace
    target_label: __address__
    regex: (.+)(?::\d+);(\d+)
    replacement: $1:$2
  - action: labelmap
    regex: __meta_kubernetes_service_label_(.+)
Configuration for Mobile Foundation server health check monitoring,YAML snippet below:
# Configuration for MFP Health check  Monitoring<br/>
- job_name: 'mfp-healthcheck'
metrics_path: /mfpadmin/management-apis/2.0/diagnostic/healthCheck
scheme: 'https'
basic_auth:
  username: 'admin'
  password: 'admin'
tls_config:
  insecure_skip_verify: true
kubernetes_sd_configs:
  - role: endpoints
relabel_configs:
  - source_labels: [__meta_kubernetes_service_annotation_mfpfserver]
    action: keep
    regex: true
  - source_labels: [__address__, __meta_kubernetes_service_annotation_prometheus_io_port]
    action: replace
    target_label: __address__
    regex: (.+)(?::\d+);(\d+)
    replacement: $1:$2
  - action: labelmap
    regex: __meta_kubernetes_service_label_(.+)
Note: Mobile Foundation Analytics and Application Center deployments follow the similar Metrics configuration.
Value of job_name and source_labels changes as described earlier.
Step 3: Reload Prometheus configuration after updating the jobs
Execute the curl command below:
curl -s -XPOST http://<ip address of the proxy node>:31271/-/reload

Step 4: Monitoring the Mobile Foundation statistics
a. Browse to the Prometheus console from a browser using the URL:
http://<ip address of the Proxy Node>:31271
b. In the Prometheus console, first click on Status and then select Targets from the drop-down as shown in the screenshot below:
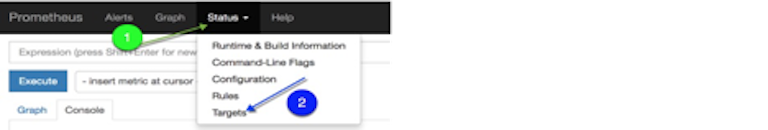 c. You should see all the Targets whose statistics is being obtained by Prometheus.

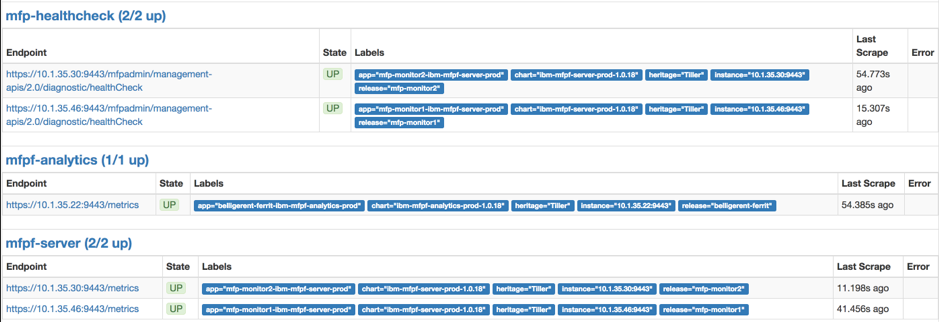
This screenshot above clearly shows the Mobile Foundation Server, Analytics and Application Center Targets. Refer to the value of job_name attribute of the configmap YAML file shown in step 2.
We scaled up our deployment sample to two replicas, and which is why Prometheus shows two endpoints getting scraped for Server.
If you click on Graph in the Prometheus console and in the subsequent panel, click the insert metric at cursor as shown in screenshot below:
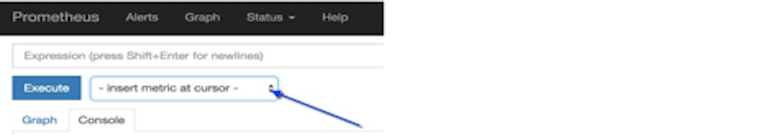
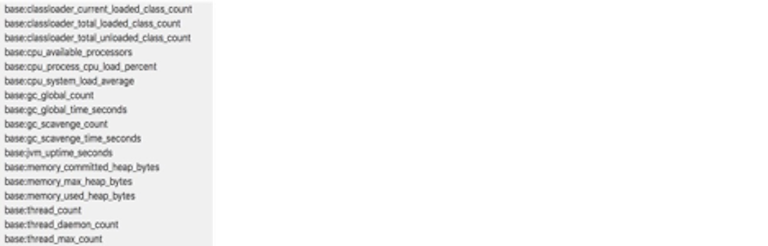
You will see a number of metrics that can be monitored by the present Prometheus configuration. Among the metrics in the long list, the metric names starting with base: are from the Mobile Foundation containers contributed by the mpMetrics-1.0 feature.
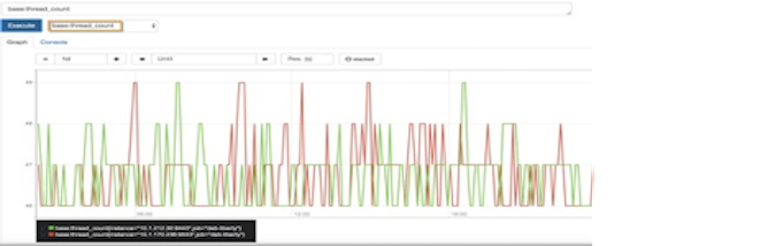
Selecting any Liberty metric (eg: base:thread_count), you can see the values from both the Mobile foundation Server pods in the Prometheus graph, as shown in screenshot below:
You can explore other relevant metrics in Prometheus in graphical as well as in numeric form by clicking Console.
You can also scale your deployments. Within a short period of time the number of endpoints in the Prometheus console will match the number of replicas.
Note: Though we have used clear text for password in the configmap file of Prometheus, Prometheus will not display the password when its configuration is viewed in the Prometheus panel.
Step 5: View Metrics on Grafana dashboard
Mobile Foundation helm charts contains sample Grafana dashboard json files, Monitoring service deployed in step 1 has Grafana in place.
Importing a Grafana dashboard from a JSON file is as below:
-
Launch Grafana from the deployed monitoring service.
Workloads -> Helm releases -><name used for the helm release>(ex: mfp-prometheus) ->Launch) -
Download the JSON dashboard file from GitHub to your local workstation.
-
Click the Home button in the Grafana interface, then click Import Dashboard.
-
Click the Upload .json file button and select the Grafana dashboard JSON file from your local filesystem.
-
Select prometheus from the Select a data source menu, if it is not already selected.
-
Click Import.
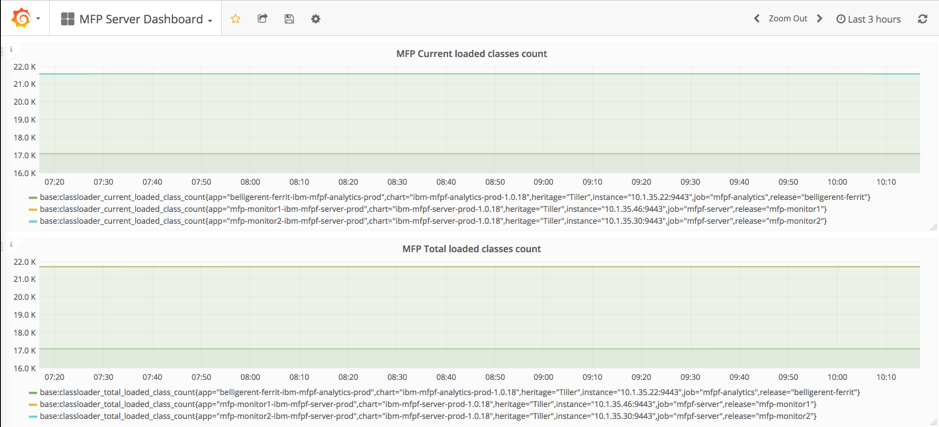
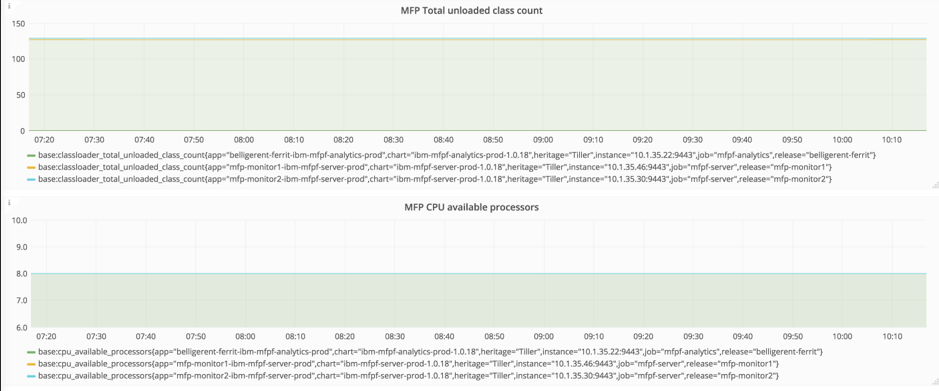
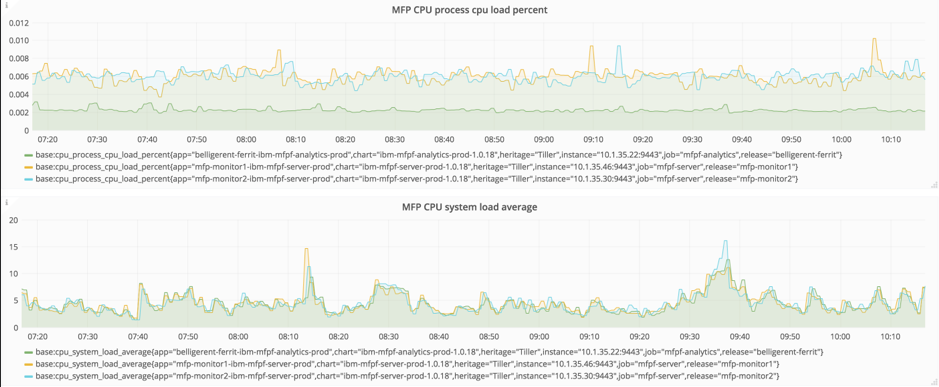
Sample Monitoring Dashboard for Mobile Foundation Server is shown in the screenshot below:
Inclusive terminology note: The Mobile First Platform team is making changes to support the IBM® initiative to replace racially biased and other discriminatory language in our code and content with more inclusive language. While IBM values the use of inclusive language, terms that are outside of IBM's direct influence are sometimes required for the sake of maintaining user understanding. As other industry leaders join IBM in embracing the use of inclusive language, IBM will continue to update the documentation to reflect those changes.