在 IBM Cloud Private (ICP) 中监控 Mobile Foundation
improve this page | report issue
概述
本教程概述了如何集成 Prometheus 以监控运行在 IBM Cloud Private 上的 Mobile Foundation。
IBM Mobile Foundation 提供监控功能,通过启用 mpMetrics-1.0 功能部件可监控使用 MicroProfile 度量值 API 检测的 Mobile Foundation Server、Analytics 和 Application Center。这有助于监控 ICP 上所部署的 Mobile Foundation 容器的 JVM 和系统级别度量值。
/metrics API 请求的缺省响应格式为与 Prometheus 兼容的文本格式。
过程
完成下面的步骤以在 IBM Cloud Private 上设置 Mobile Foundation 的监控。
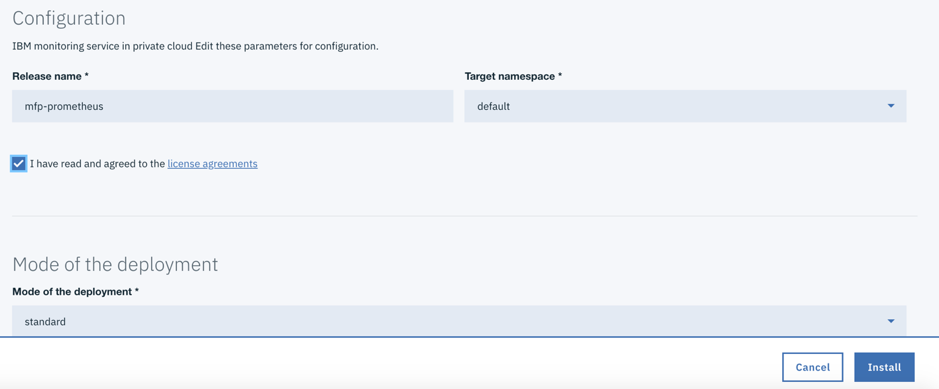
步骤 1:部署 IBM 监控服务
a. 从 IBM Cloud Private 目录部署监控服务。
b. 转至目录,选择 ibm-icpmonitoring helm 图表并安装。将在 IBM Cloud Private 中安装 helm 图表。
步骤 2:更新 Prometheus configmap 配置
从正确来源的终端(即包含 ICP 集群的上下文配置信息的 CLI 实例)运行以下命令:
kubectl get svc | grep prometheus
您将看到一些通过 ibm-icpmonitoring 图表部署的服务。在本教程中,我们将关注并使用名为 <name used for the helm release>-promethues (mfp-prometheus-prometheus) 的服务,如下面的屏幕快照所示:

其中每个服务都具有关联的 configmap 对象。要获取 Mobile Foundation pod 的度量值数据,您必须通过将 Mobile Foundation 服务器的 mfpfserver 注释、Analytics 的 mfpfanalytics 注释和 Application Center 的 mfpfanalytics 注释添加到服务部署以及添加一些其他属性,来修改与 mfp-prometheus-prometheus 服务关联的 configmap。
实现此操作的最简单方法是使用以下命令从来源终端编辑预期的 configmap 对象:
kubectl edit configmap mfp-prometheus-prometheus
此命令将在 vi 编辑器中显示请求的 YAML 文件。向下滚动至文件末尾并在 kind: ConfigMap 行前直接插入下面的文本。
Mobile Foundation 服务器度量值配置,YAML 片段如下:
# Configuration for MFP Server Monitoring
- job_name: 'mfpf-server'
scheme: 'https'
basic_auth:
  username: 'mfpRESTUser'
  password: 'mfpadmin'
tls_config:
  insecure_skip_verify: true
kubernetes_sd_configs:
  - role: endpoints
relabel_configs:
  - source_labels: [__meta_kubernetes_service_annotation_mfpfserver]
    action: keep
    regex: true
  - source_labels: [__address__, __meta_kubernetes_service_annotation_prometheus_io_port]
    action: replace
    target_label: __address__
    regex: (.+)(?::\d+);(\d+)
    replacement: $1:$2
  - action: labelmap
    regex: __meta_kubernetes_service_label_(.+)
Mobile Foundation 服务器运行状况检查监控的配置,YAML 片段如下:
# Configuration for MFP Health check  Monitoring<br/>
- job_name: 'mfp-healthcheck'
metrics_path: /mfpadmin/management-apis/2.0/diagnostic/healthCheck
scheme: 'https'
basic_auth:
  username: 'admin'
  password: 'admin'
tls_config:
  insecure_skip_verify: true
kubernetes_sd_configs:
  - role: endpoints
relabel_configs:
  - source_labels: [__meta_kubernetes_service_annotation_mfpfserver]
    action: keep
    regex: true
  - source_labels: [__address__, __meta_kubernetes_service_annotation_prometheus_io_port]
    action: replace
    target_label: __address__
    regex: (.+)(?::\d+);(\d+)
    replacement: $1:$2
  - action: labelmap
    regex: __meta_kubernetes_service_label_(.+)
注:Mobile Foundation Analytics 和 Application Center 部署遵循类似的度量值配置。
job_name 和 source_labels 的值如先前所述更改。
步骤 3:在更新作业后重新装入 Prometheus 配置。
执行以下 curl 命令:
curl -s -XPOST http://<ip address of the proxy node>:31271/-/reload

步骤 4:监控 Mobile Foundation 统计信息
a. 使用 URL 通过浏览器浏览至 Prometheus 控制台:
http://<ip address of the Proxy Node>:31271
b. 在 Prometheus 控制台中,先单击状态,然后从下拉菜单中选择目标,如下面的屏幕快照中所示:
 c. 您应该会看到通过 Prometheus 获取其统计信息的所有目标。

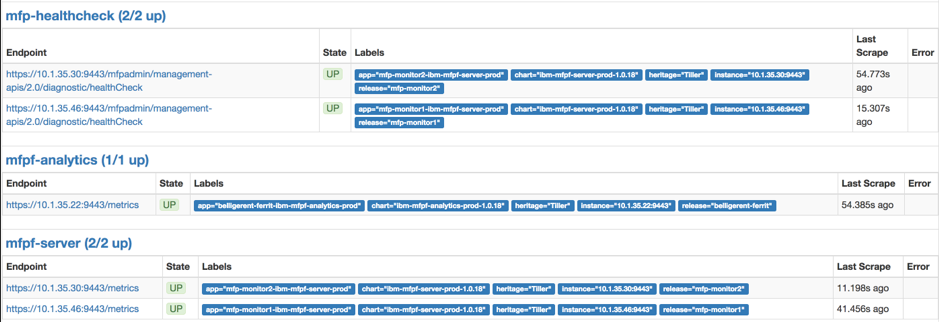
上面的屏幕快照清楚地显示了 Mobile Foundation 服务器、Analytics 和 Application Center 目标。请参阅步骤 2 中所显示的 configmap YAML 文件的 job_name 属性的值。
我们将部署样本扩展为两个副本,因此 Prometheus 显示了为服务器抓取的两个端点。
如果单击 Prometheus 控制台和后续面板中的图形,然后单击在光标处插入度量值,如下面的屏幕快照所示:
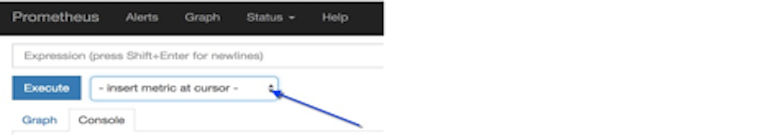
您将看到一些可由当前的 Prometheus 配置监控的度量值。在长列表内的度量值中,以 base: 开头的度量值名称来自通过 mpMetrics-1.0 功能部件添加的 Mobile Foundation 容器。
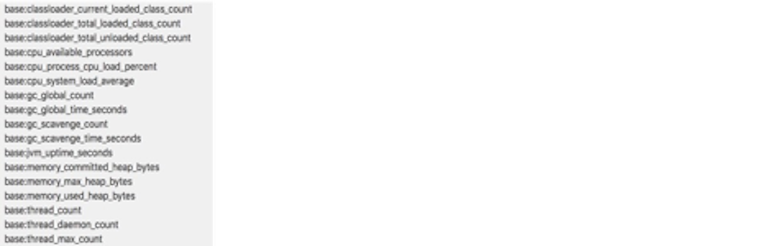
选择任何 Liberty 度量值(例如 base:thread_count),您可以看到来自 Prometheus 图形中两个 Mobile Foundation 服务器 pod 的值,如以下屏幕快照所示:
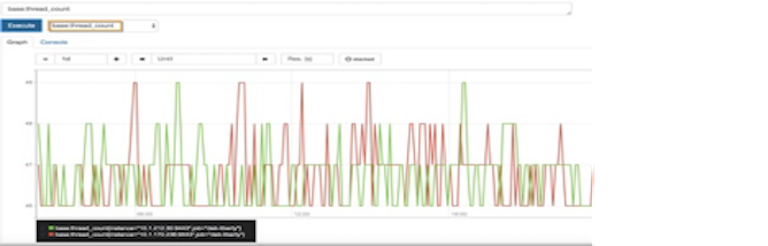
您可以通过单击控制台,以图形形式和数字形式探究 Prometheus 中的其他相关度量值。
您还可以扩展自己的部署。在很短的时间内,Prometheus 控制台中的端点数量将与副本数量相匹配。
注:虽然我们在 Prometheus 的 configmap 文件中使用了明文密码,但在 Prometheus 面板中查看其配置时,Prometheus 不会显示该密码。
步骤 5:在 Grafana 仪表板上查看度量值
Mobile Foundation helm 图表包含样本 Grafana 仪表板 json 文件,在步骤 1 中部署的监控服务具有 Grafana。
按照如下所述从 JSON 文件导入 Grafana 仪表板:
-
从部署的监控服务启动 Grafana。
工作负载 -> Helm 发行版 -><name used for the helm release>(例如:mfp-prometheus)->启动) -
将 JSON 仪表板文件从 GitHub 下载到您的本地工作站。
-
单击 Grafana 界面中的主页按钮,然后单击导入仪表板。
-
单击上载 .json 文件按钮,然后从本地文件系统中选择 Grafana 仪表板 JSON 文件。
-
如果尚未从选择数据源菜单中选择 prometheus,请进行选择。
-
单击导入。
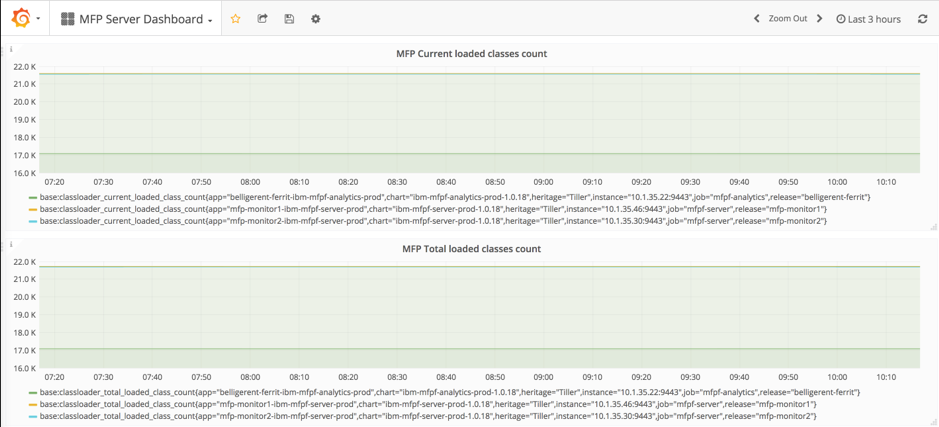
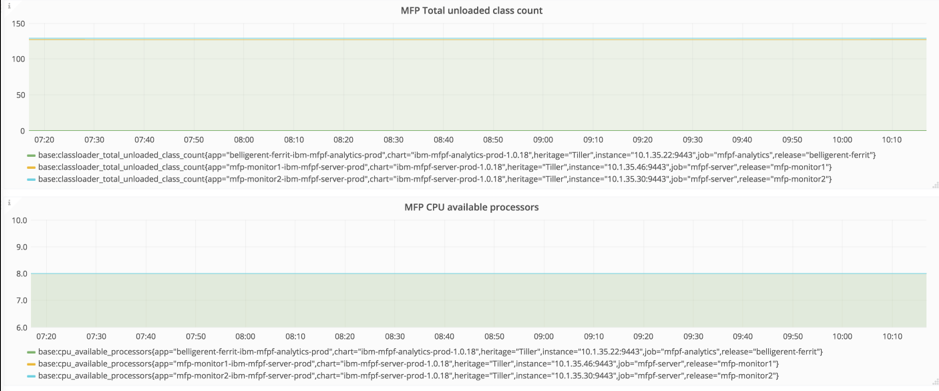
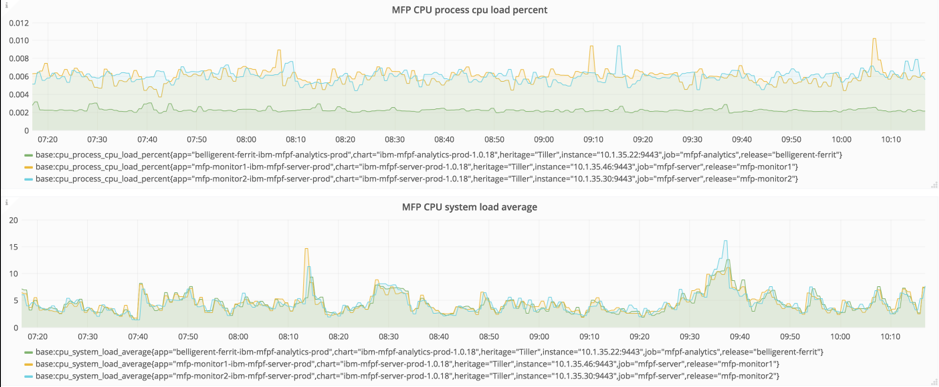
Mobile Foundation 服务器的样本监控仪表板如下面的屏幕快照所示:
Inclusive terminology note: The Mobile First Platform team is making changes to support the IBM® initiative to replace racially biased and other discriminatory language in our code and content with more inclusive language. While IBM values the use of inclusive language, terms that are outside of IBM's direct influence are sometimes required for the sake of maintaining user understanding. As other industry leaders join IBM in embracing the use of inclusive language, IBM will continue to update the documentation to reflect those changes.