Debugging applications
improve this page | report issueOverview
This tutorial explores various approaches to debugging the web resources of a MobileFirst application, either before running the application in a device or while running it in a device.
The tutorial also explores the debugging of MobileFirst adapters and the tools that are available to the developer to conduct the debugging effort.
The following debugging options are covered:
- What is debugging?
- Debugging on a desktop browser
- Debugging with Mobile Browser Simulator
- Debugging with iOS Remote Web Inspector
- Debugging with Chrome Remote Web Inspector
- Debugging with Weinre
- Debugging with IBM MobileFirst Logger
- Testing adapter procedures
- Debugging with WireShark
What is debugging?
Debugging is a process that consists of finding the cause of defects in the application code and UI.
- MobileFirst applications consist of web-based resources and optional native code (such as Java, Objective-C and C#).
- You can debug native code by using standard tools that are provided by the platform SDK, such as XCode, Android LogCat/ADB, or Microsoft Visual Studio.
Debugging on a desktop browser
Modern browsers, such as Chrome, Firefox, Safari, or Opera, provide an easy and convenient way to debug web apps.
As seen in the previous tutorials, during development you can preview applications in a desktop browser by using the MobileFirst Operations Console.
Many web tools for debugging are available on various desktop browsers, for example:
- FireBug
- Chrome Developer Tools
- Internet Explorer Developer Tools
- Dragonfly for Opera
- Safari Web Inspector
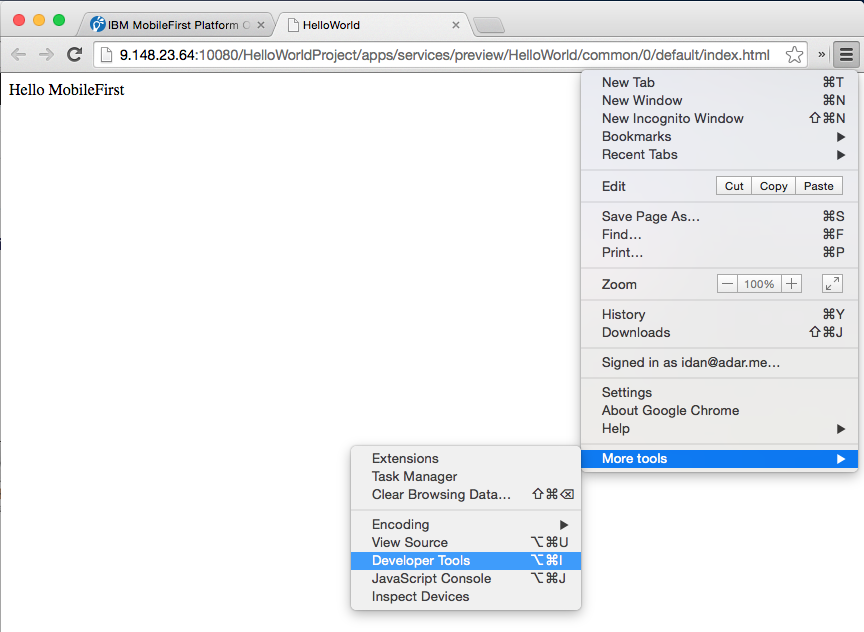
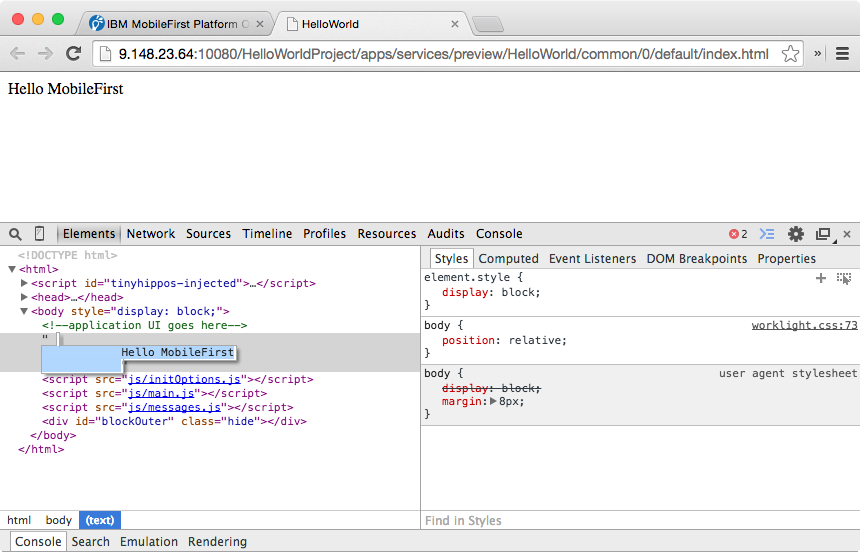
In early application development stages, these tools can be used to debug the application just like a regular website. It is not required to install them in a mobile device.
You can also preview changes to HTML and CSS in real time by modifying the values in the inspector.
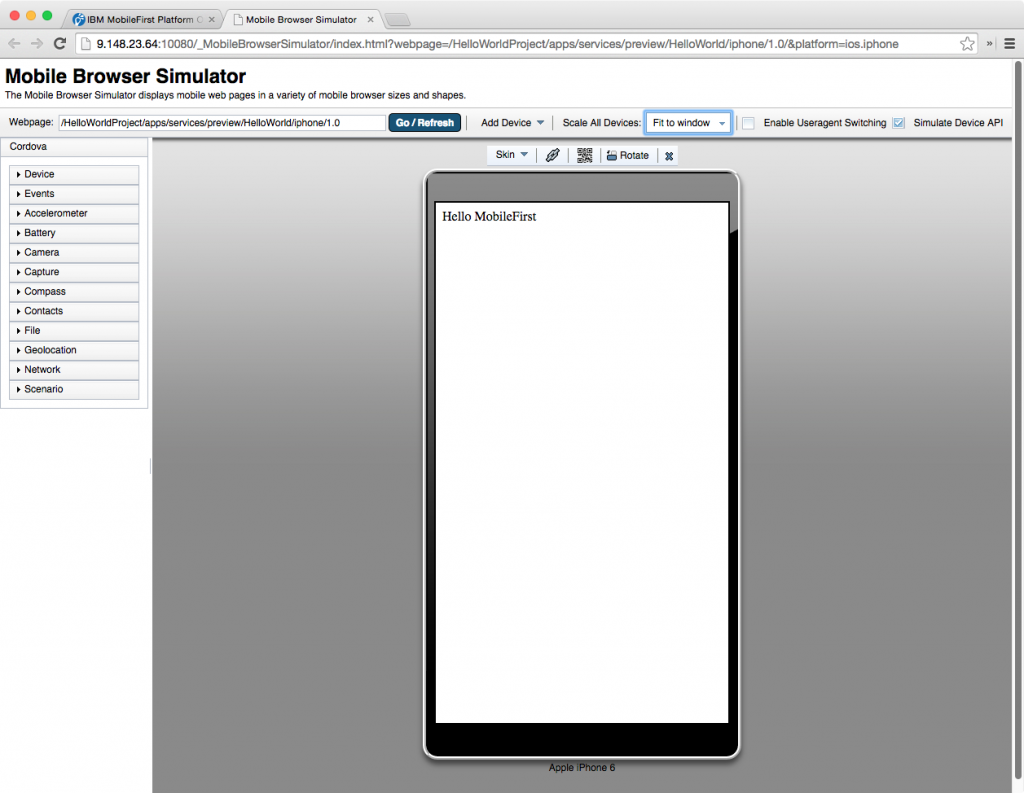
Debugging with the Mobile Browser Simulator
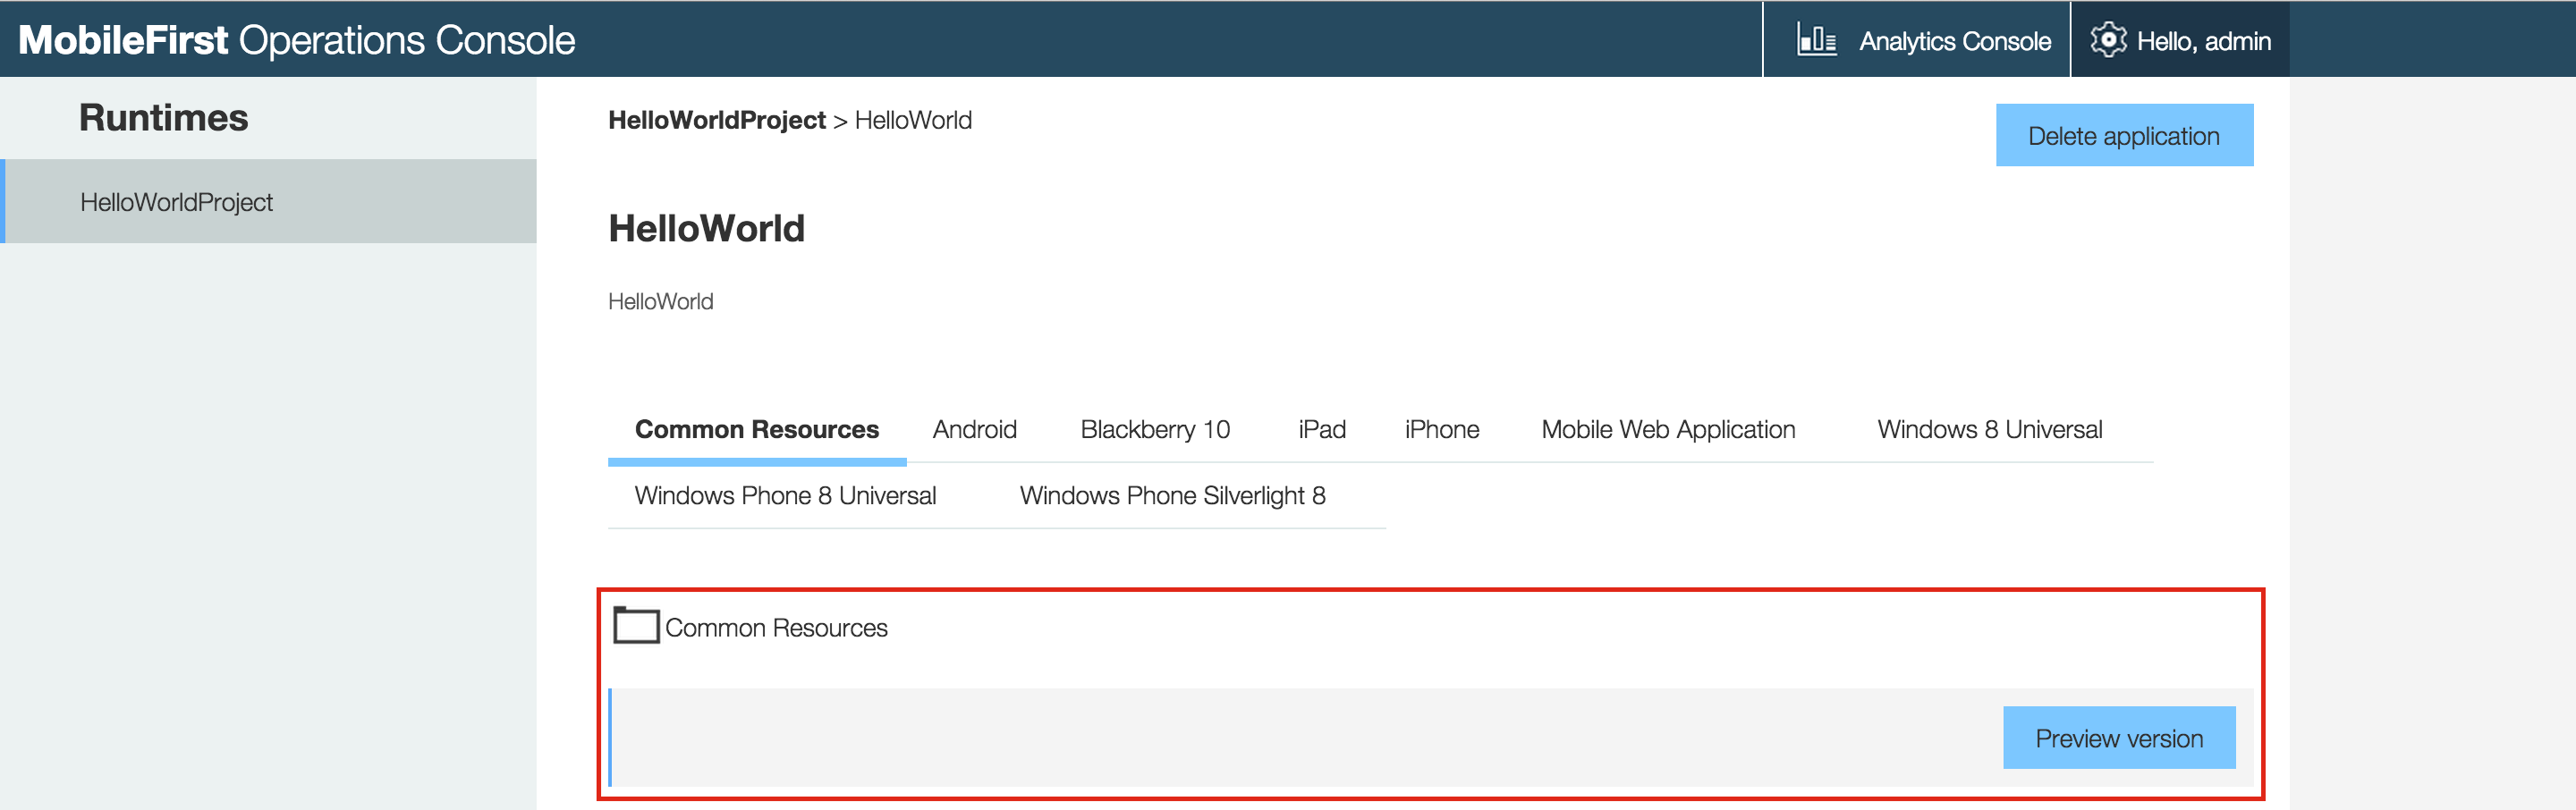
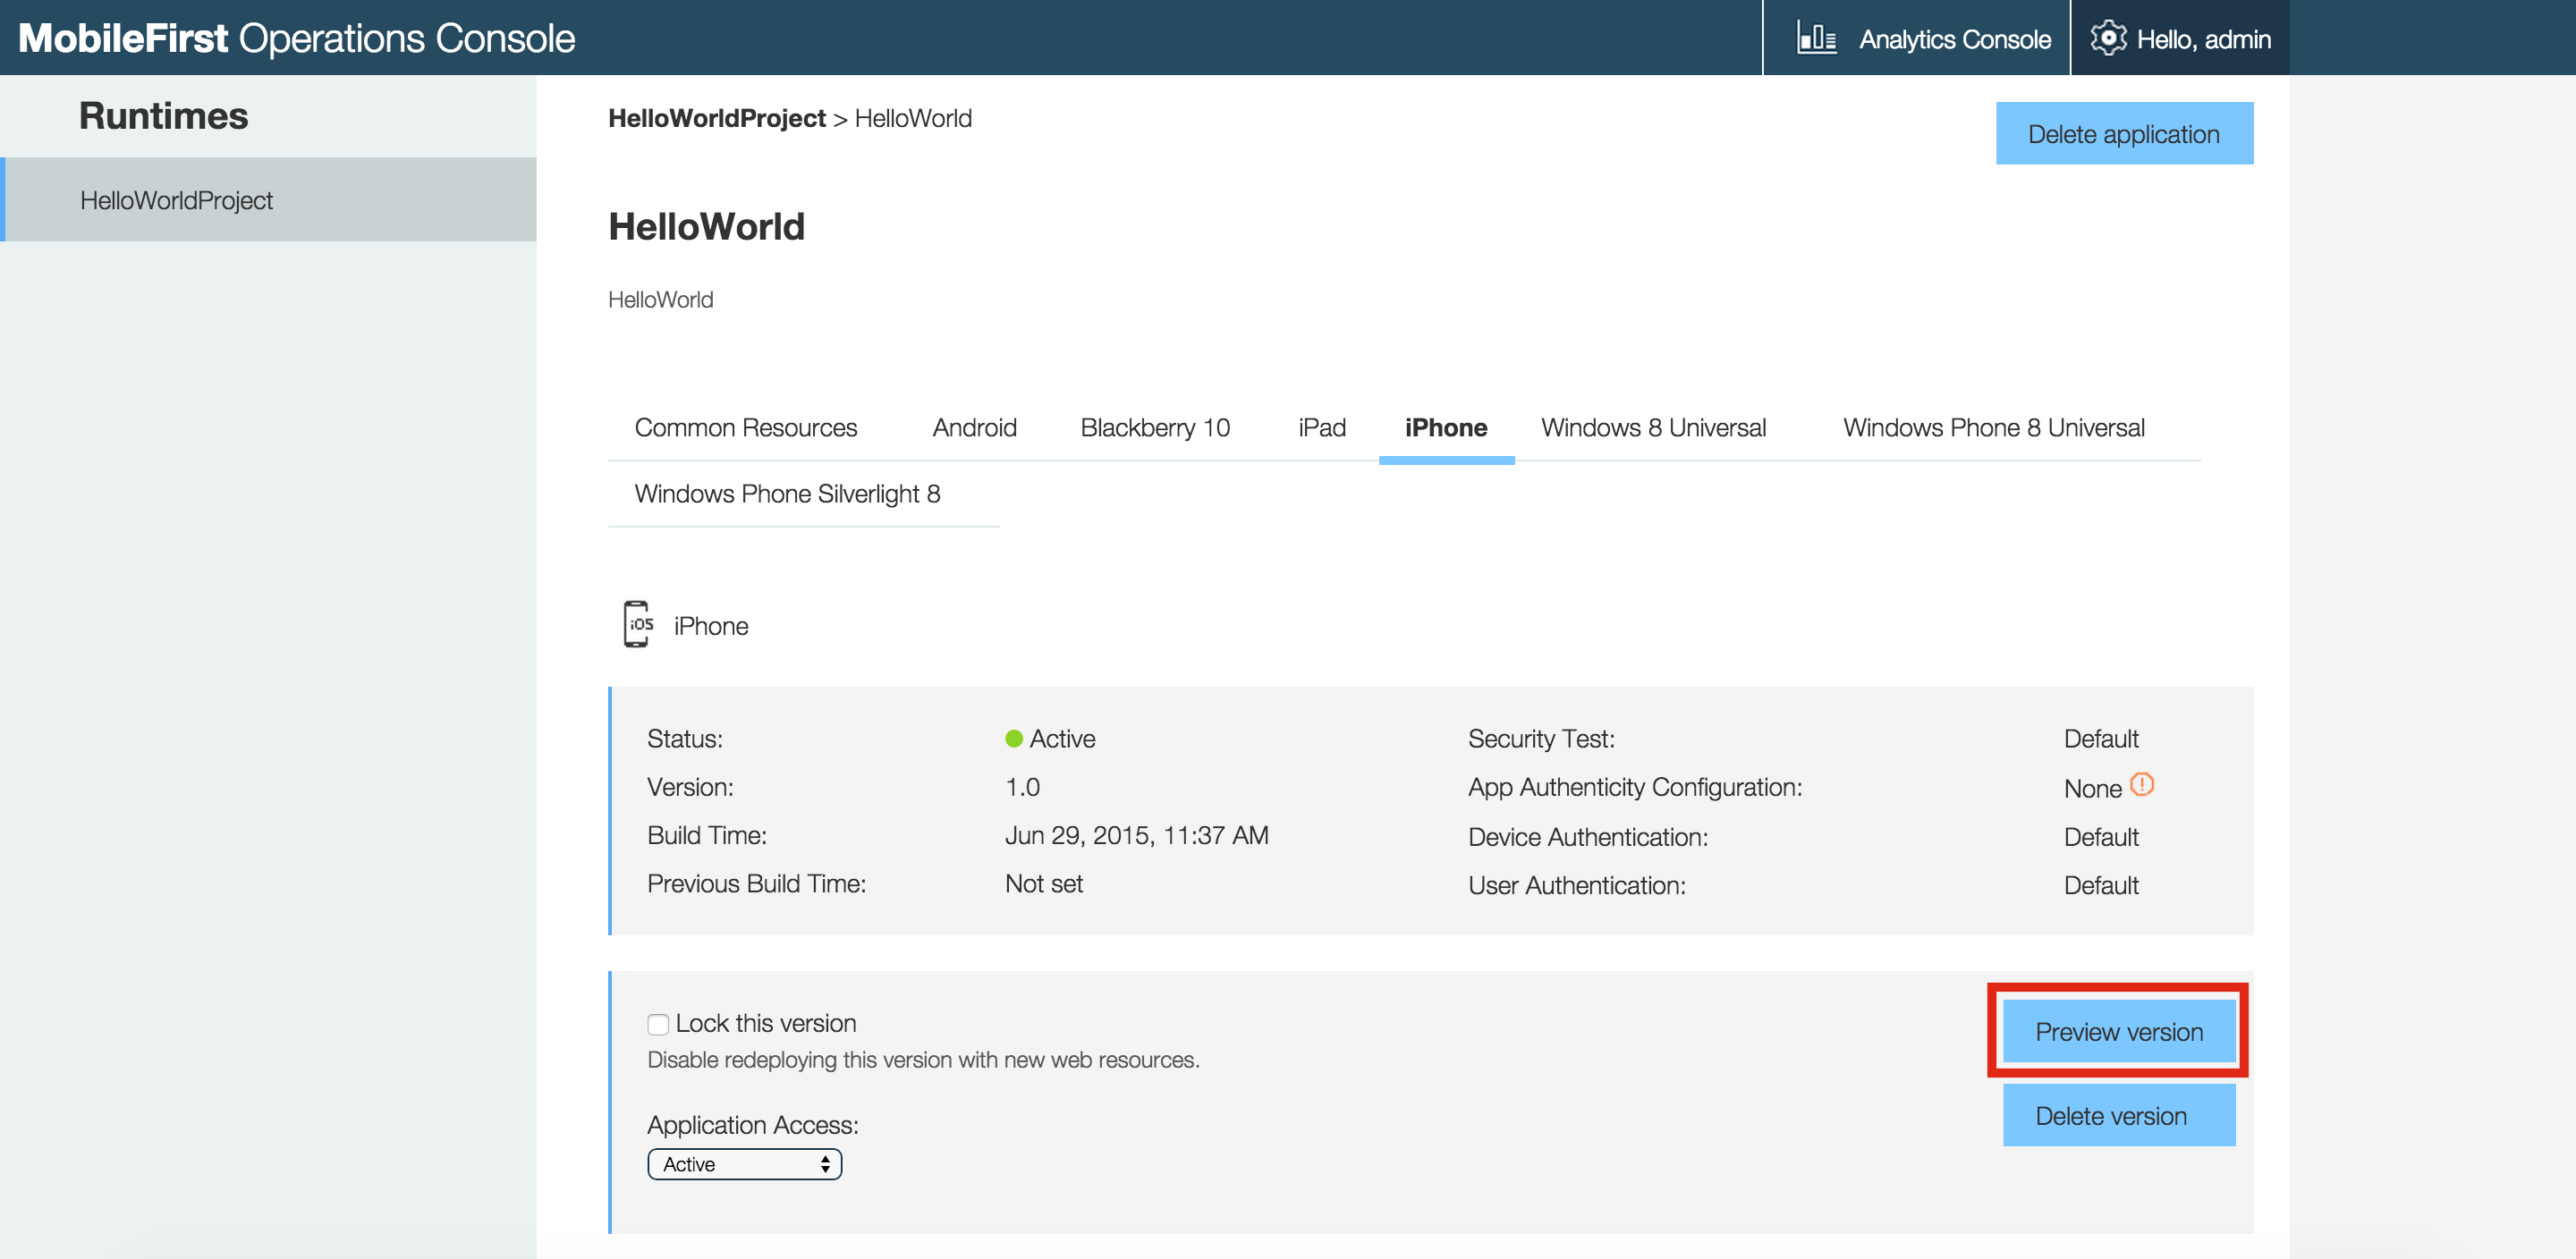
You can also use the Mobile Browser Simulator to preview and debug MobileFirst applications.
To access it, click the Preview button in the MobileFirst Operations Console.
The Mobile Browser Simulator has several added values over Preview as Common Resources, for example:
- Preview environment-specific resources
- Emulate different devices and skins
- Emulate some Cordova features such as access to sensors and other hardware
Debugging with iOS Remote Web Inspector
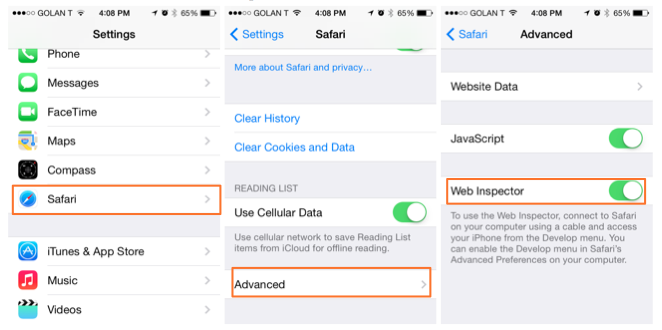
Starting in iOS 6, Apple introduced a remote web inspector for debugging web applications on iOS devices. To debug, make sure that the device (or simulator) has the Private Browsing option turned off.
To enable Web Inspector on the device, click Settings > Safari > Advanced > Web Inspector.
- To start debugging, connect the iOS device to a Mac, or start the simulator. Safari 6.0 or higher is required.
In Safari, go to Preferences > Advanced, and select the Show Develop menu in menu bar checkbox.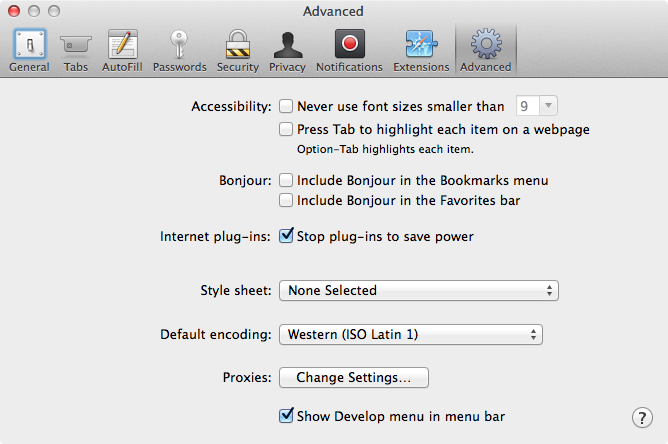
- Now in Safari, select Develop > [your device ID] > [your application HTML file].
The DOM can now be inspected. It is also possible to alter the CSS and run JavaScript commands, just as in the desktop inspector.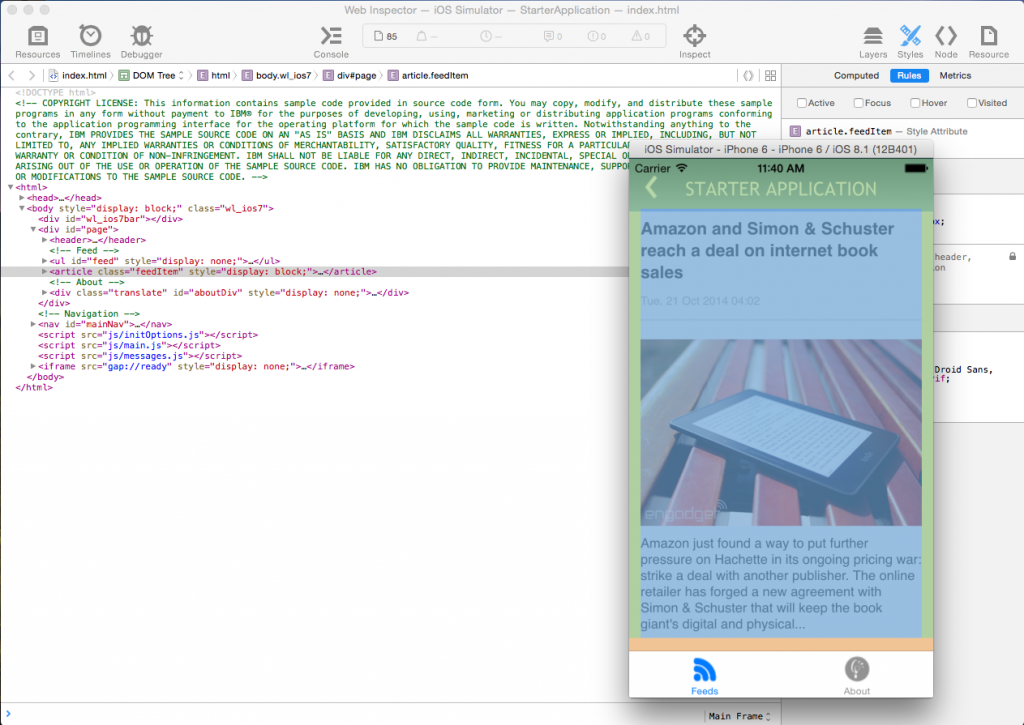
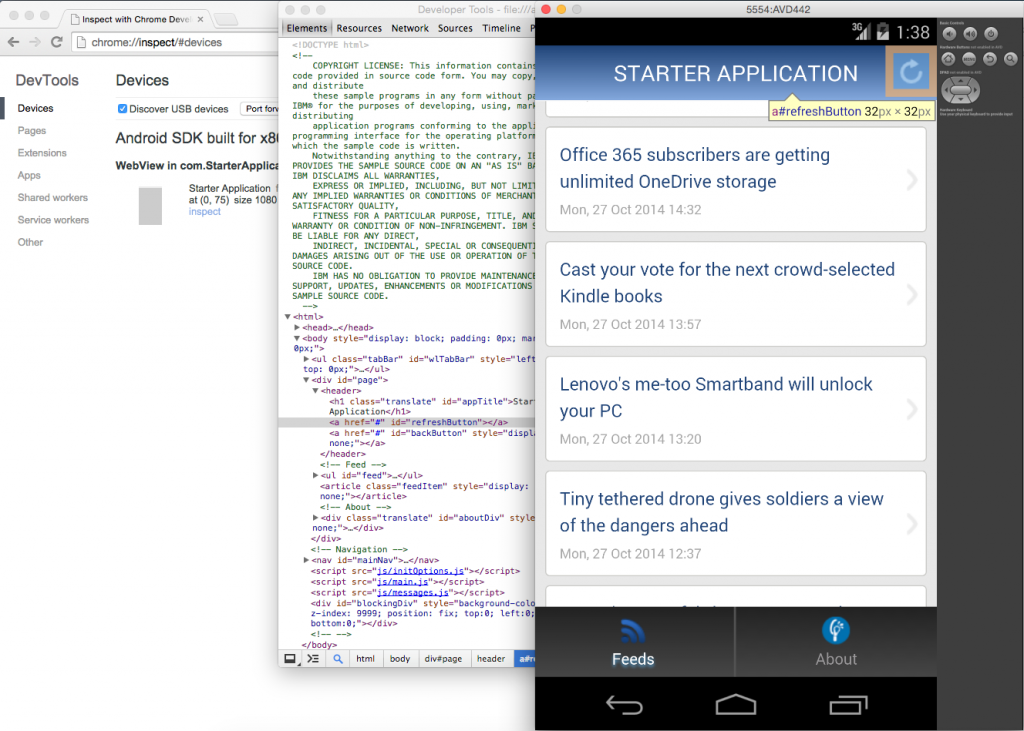
Debugging with Chrome Remote Web Inspector
With Google Chrome, it is possible to remotely inspect web applications on Android devices.
This action requires Android 4.4 or later, Chrome 32 or later, and IBM Worklight Foundation V6.2.0 or IBM MobileFirst Platform Foundation 6.3 or later.
Additionally, in the AndroidManifest.xml file, targetSdkVersion = 19 or above is required.
In the project.properties file, target = 19 or above is required.
- Start the application in the Android Emulator or a connected device.
- In Chrome, enter the following URL:
about:inspect. - Press Inspect for the relevant application.
You can now use all the features of the Chrome Inspector to inspect the Android application.
Debugging with Weinre
Weinre stands for Web Inspector Remote.
Weinre is a debugger for web pages, like Firebug or other Web Inspectors, except that Weinre is designed to work remotely.
Weinre can be used to inspect and debug web resources such as HTML, JavaScript, CSS, and network traffic on mobile handsets.
The Weinre architecture includes the following components:
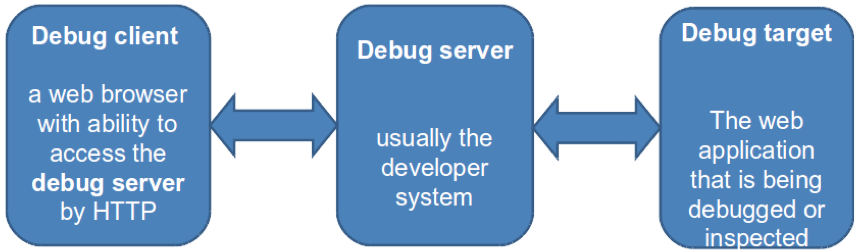
The Weinre debug server requires a node.js runtime.
You can find instructions to install Weinre on the Weinre installation page.
Debug server
When the Weinre server is installed, enter the following command to run it:
weinre --httpPort 8888 --boundHost -all-
This command starts a Weinre server. The default port is 8888 but you can change it.
Target
The Weinre server must be accessible from the device that will be used for debugging. To make it accessible, add the following code line to the web application:
<script src="http://a.b.c:8888/target/target-script-min.js"></script>
Where a.b.c is the hostname or IP of the Weinre server.
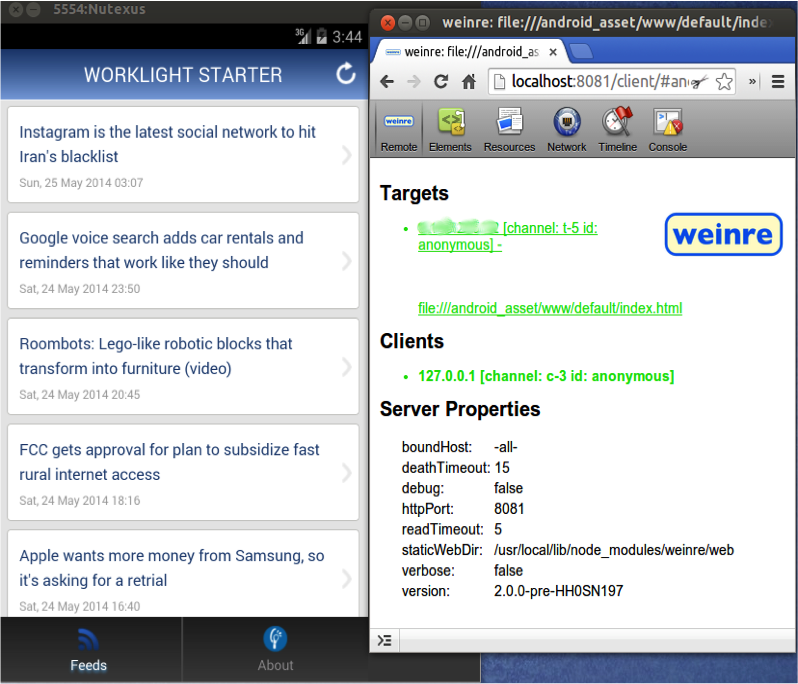
Client
Before you can start debugging, make sure that the application is open and loaded on the browser with this URL:
Debugging with IBM MobileFirst Logger
IBM MobileFirst Platform Foundation provides a WL.Logger object which can be used to print log messages to the log for the environment used.
Two of its methods are WL.Logger.debug() and WL.Logger.error().
These APIs are multiplatform. The output destination changes according to the platform on which that application runs:
- Developer console when it is running on a desktop browser
- LogCat when it is running on Android device
- Visual Studio Output when it is running on a Windows Phone 8 device and Windows 8 App
- XCode Console when it is running on an iOS device
WL.Logger contains more methods.
For more information, see the documentation for
WL.Loggerin the API reference part of the user documentation.
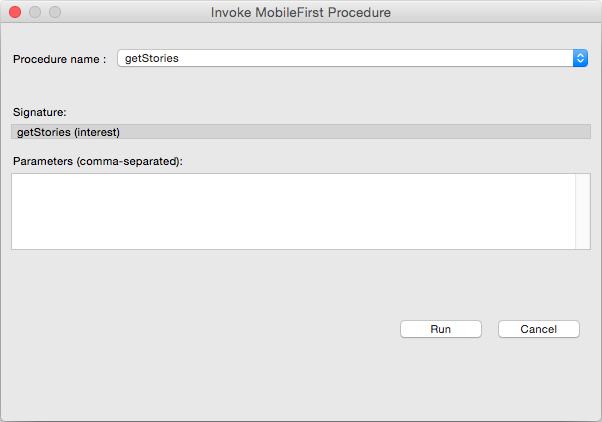
Testing adapter procedures
You can test adapter procedures by using MobileFirst Studio.
To test a procedure:
- Right-click an adapter folder and select Run As > Invoke MobileFirst Procedure.
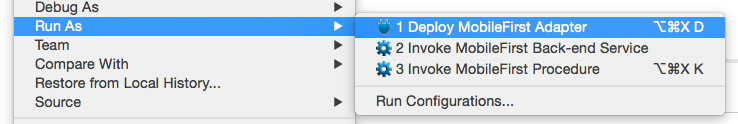
The adapter and procedure are selected.
- Optionally, enter comma-separated parameters.
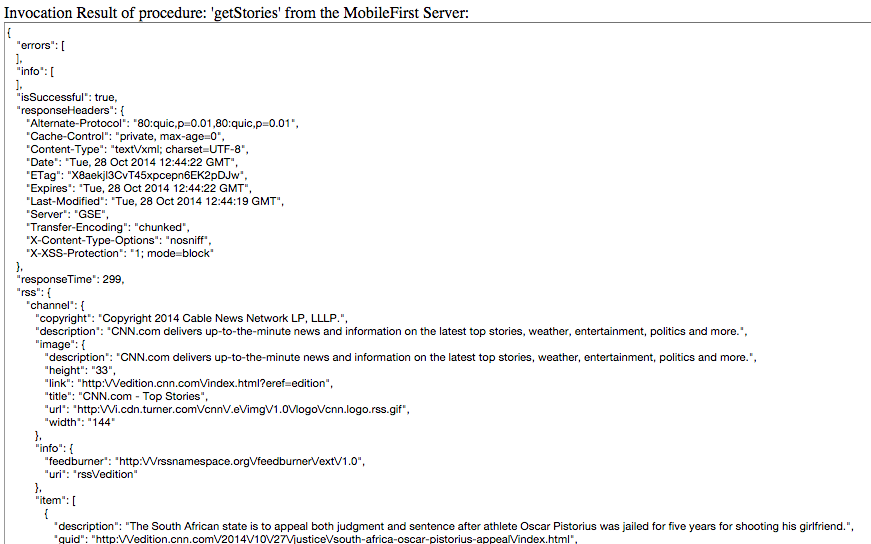
Adapter invocation result:
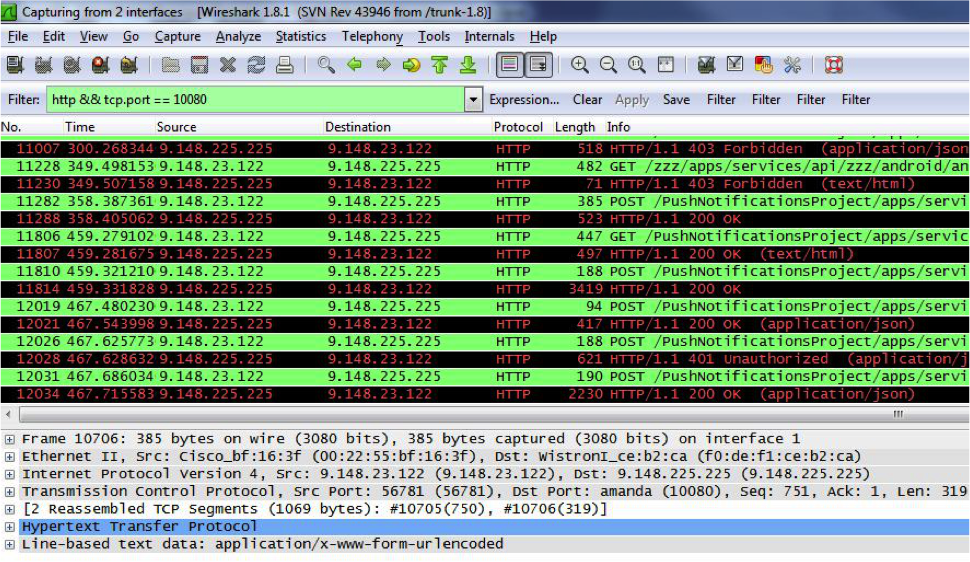
Debugging with WireShark
Wireshark is a network protocol analyzer that can be used to see what happens in the network.
You can use filters to follow only what is required.
For more information, see the WireShark website.
Inclusive terminology note: The Mobile First Platform team is making changes to support the IBM® initiative to replace racially biased and other discriminatory language in our code and content with more inclusive language. While IBM values the use of inclusive language, terms that are outside of IBM's direct influence are sometimes required for the sake of maintaining user understanding. As other industry leaders join IBM in embracing the use of inclusive language, IBM will continue to update the documentation to reflect those changes.